

Arkansas 2007-2008 School District Rankings
Michael T. Scoles, Ph.D.1
Overview
The Arkansas Policy Foundation (APF) has provided letter- grade rankings of Arkansas school districts, beginning with the spring 2005 administration of the Iowa Test of Basic Skills (ITBS). For the 2007-2008 school year, the Arkansas Department of Education (ADE) began using the Stanford Achievement Test – 10th Edition (SAT-10). Both the ITBS and SAT-10 are norm- referenced tests that report scores in several formats. These include scaled scores, percentile ranks, and normal curve equivalent scores. Of these, percentile ranks are the easiest to interpret, and they have been the choice for publication by ADE.
Percentile ranks do not lend themselves to direct statistical analysis (Glass & Hopkins, 1996). In previous district letter- grade rankings by APF, Dr. Mark Witkowski stated that percentile ranks were derived from the more statistically appropriate scaled scores, and based his analyses on these scaled scores from the ITBS (Arkansas Policy Foundation, 2006, 2007, 2008).
Unfortunately, the scaled scores from the ITBS and SAT-10 are not directly comparable as they are represented in different units. If, in the future, ADE reverts to using ITBS or chooses another norm-referenced test, comparisons of different scoring systems would be as awkward as making comparisons between physical measurements based on English or metric systems. The task is not impossible, just inconvenient.
Just as scaled scores can be converted to percentile ranks, those percentile ranks can be converted to any arbitrary system of (normalized) scaled scores for statistical analysis. The choice in thisreport was to convert percentile ranks to T-scores, a common standard score based on a normal distribution with a mean of 50 and a standard deviation of 10 points. Regardless of which norm-referenced test ADE should choose to adopt, conversion of percentile ranks to T- scores will provide consistency in interpretation over time.
Dr. Witkowski’s reports assigned letter grades to districts based on 9th-grade scores on the math and verbal subtests of the ITBS, and on total (math + verbal) subtest scores. Scores on the mathematics (math) and reading comprehension (reading) portions of the SAT-10 for 9th grade scores are the basis for this report.
In addition to these measures, an attempt has been made to consider economic and social factors outside of a school district’s control. The approach has some similarities to one taken in 2006 by Jay P. Green and his associates at the University of Arkansas Department of Education Reform (Green, Barnett, Ritter, & Winters, 2006). They considered “school and district factors” such as ethnicity, poverty (percent free or reduced lunch), enrollments, median family income, percent of adults with high school and college diplomas, percent of families with school-age children who are married, and per-pupil expenditures. Multiple regression was used to determine the
1 Dr. Scoles received his Ph.D. in Psychology from Northern Illinois University in 1982. He has published and given professional presentations on assessment of instructional effectiveness, basic learning processes, bereavement, laboratory instrumentation, psychopharmacology, and school reform. He teaches courses in statistics ranging from introductory to multivariate methods.
relationship between these factors and scores on the ITBS and Grade 11 End-of-Course examinations, and this relationship was then used to predict test performance based on school and district factors. A “School Performance Index” (SPI) of 100 was assigned where actual performance and predicted performance were the same. Discrepancies between actual and predicted performance would result in lower or higher SPIs.
There are some statistical issues that create limitations for the SPI. First, percentile ranks on examinations were used as indicators of school or district performance. As has already been mentioned, standard scores are preferable to percentile ranks for statistical analysis. Perhaps more important is that many of the school and district factors (e.g., poverty and median family income) are practically redundant. The presence of redundant predictors is a problem for multiple regression known as “multicollinearity”, and tends to make the final model unstable (Tabachnick & Fidell, 2007). Despite these problems, the use of numerous demographic factors to predict school performance is quite common in the literature (e.g., Coleman et al., 1966, Sutton & Soderstrom, 1999).
If the intent is to measure school performance in the face of demographic and economic factors that could affect that performance, a simpler approach might be possible. The analysis presented in this report used SAT-10 performance in the first grade as a measure of factors that are largely external to the district. The assumption was that the relative contribution of externa l factors rather than pedagogy is greatest at the earliest grade levels. Therefore, 1st-grade performance could be used as a single indicator of the advantages and disadvantages that exist outside of the school setting, and that are present simultaneously at other grade levels. Although this approach ofpredicting district high-school performance on standardized tests from concurrent performance at early grades is novel, longitudinal research has demonstrated that performance at early grades ispredictive of high-school dropout rates (Ensminger & Slusarcick, 1992) for at-risk students.
Details of the method used in this report to assign letter grades to districts are provided below, but can be summarized as follows:
- 1st and 9th- grade national percentile ranks on SAT-10 math and reading were converted to state-normed T-scores;
- Math and reading letter grades were assigned based on state T-scores at the 9th grade;
- “Adjustment” letter grades were assigned based on the discrepancy between actual 9th- grade scores and what would be predicted given external characteristics measured by 1st- grade scores;
- Overall letter grades were based on the average of 9th- grade math, 9th-grade reading, and adjustment letter grades.
Methodology for District Ra nkings
Conversion of National Percentile Ranks to State Standard Scores (T-scores)
National percentile ranks for each district’s SAT-10 reading and math scores at the 1st and 9th- grades were converted to standard scores, reported with a mean of 50 and a standard deviation of
10 points (national T-scores). For example, on 9th- grade math, the Star City School District scored at the national 70th percentile. This corresponds to a national T-score of 55.24.
The mean national T-scores for the state’s districts and the corresponding standard deviations are as follows:
1st-grade 9th- grade
| Math | Reading | Math | Reading | |
| Mean | 49.72 | 47.96 | 52.86 | 49.29 |
| Standard Deviation | 3.45 | 3.53 | 2.49 | 3.10 |
The purpose of this report is to compare school districts within Arkansas which, as is reflected in the standard deviations being well below 10, is a more homogenous group than districts from across the nation. For this reason, the T-scores based on national norms were converted to T- scores for the state. From the Star City School District example, the 9th-grade math T-score based on the district’s national percentile rank was 55.24. Although more than 5 points above the national average of 50, it is less than 3 points above the state average of 52.86. However, given the smaller state standard deviation, the corresponding state T-score was 59.57.
State Percentile Ranks and Letter Grades for 9th-Grade Math and Reading
To provide some consistency between this report and reports from previous years provided by Witkowski, the following cutoffs were adopted, based on normal distribution percentiles.
| Letter Grade | Minimum
Percentile |
Minimum
State T-score |
| A | 90th | 62.81 |
| B | 65th | 54.85 |
| C | 20th | 41.58 |
| D | 5th | 33.55 |
T-scores below 33.55 indicated a grade of “F.” With a T-score of 59.57 in math, Star City SchoolDistrict was assigned a “B” letter grade in math.
Adjustment for External District Characteristics
A number of social and economic characteristics of a district are external to those qualities of the educational program offered by the district that affect student achievement. Rather than attempt to enumerate and provide measures of all of these characteristics, it would seem that the most obvious indicator of a district’s challenges (or advantages) would be the preparedness of its youngest students for education. In this report, performance on the SAT-10 at the 1st-grade was chosen to reflect this preparedness. It should be recognized that this use of 1st-grade scores is notmeant to resemble a longitudinal analysis, or a measure of growth from 1st to 9th grade. It is simply a measure of external characteristics that could presumably be related to performance at all grade levels.
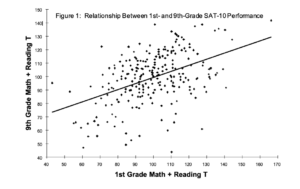
For each district, the state T-scores for 1st- grade math and reading were summed, as were those for 9th-grade math and reading. Using standard (ordinary least-squares) two- variable regression, these summed scores for the 244 districts that reported 1st and 9th-grade results were used to fit amodel that predicted a district’s 9th- grade total from the 1st-grade total. A scatter plot showing the relationship between the 1st and 9th- grade totals is presented in Figure 1. The correlation between these totals was moderate (r = 0.46), indicating that about 21% of the variation in 9th- grade scores was related to 1st-grade scores.
1st Grade Math + Reading T
. The prediction for a district’s 9th-grade score given its 1st-grade score can be expressed as: 9th- grade predicted total = (0.45)(1st-grade total) + 54.33.
For Star City School District, the total math and reading state T-scores at the 1st- grade was 96.49,so the predicted 9th-grade total was (0.45)(96.49) + 54.33, or 97.75. The actual 9th- grade total was 112.68, or 14.93 points above what was predicted.
Some districts performed better than predicted at the 9th-grade, and some performed worse. The discrepancies between the predicted and actual 9th- grade totals (residuals) were standardized as “adjustment” T-scores. Using the same cutoffs as for 9th- grade reading and math, these T-scores were used to assign adjustment letter grades. Star City School District’s adjustment T-score was 59.00, which translates to an adjustment letter grade of B.
Adjustment letter grades could not be determined for six districts that did not report 1st- grade SAT-10 scores. These were five charter schools that did not serve 1st-grade students, and Shirley School District.
Overall District Letter Grades
Using a standard 4-point scale, with an “F” being a 0 and “A” being a 4, the averages of the 9th- grade math, 9th-grade reading, and adjustment grades were used to assign overall letter grades.
| Numeric
Average |
Overall Letter
Grade |
Number of
Districts |
| 4.00 | A | 9 |
| 3.67 | A- | 8 |
| 3.33 | B+ | 10 |
| 3.00 | B | 33 |
| 2.67 | B- | 29 |
| 2.33 | C+ | 34 |
| 2.00 | C | 58 |
| 1.67 | C- | 25 |
| 1.33 | D+ | 7 |
| 1 | D | 8 |
| .67 | D- | 8 |
| .33 | D- | 6 |
| 0 | F | 9 |
Star City School District received math, reading, and adjustment letter grades of B, C, and B respectively. With a numeric average of 2.67, the district’s overall letter grade was a B-. Letter grades for all 250 evaluated school districts are provided in Table 1. Details of math, reading, and adjustment letter grade assignments, by district, are provided in an appendix to this report.
Table 1: Arkansas School District Rankings Based on Analysis of 2007-2008 SAT-10 Results
Letter grades were based on comparisons of Arkansas schools using normal equivalents (T-scores) of 9th-grade Reading & Math scores, and on an adjustment to those scores based on 1st-grade performance.
Districts with “A” Grades
| T-Scores | Letter Grades | |||||||
| Rank | District | Math | Reading | Adjustment | Math | Reading | Adjustment | Overall |
| 1 | LAKE HAMILTON | 70 | 69 | 74 | A | A | A | A |
| 2 | BENTONVILLE | 70 | 69 | 66 | A | A | A | A |
| 3 | POTTSVILLE | 64 | 73 | 67 | A | A | A | A |
| 4 | FAYETTEVILLE | 67 | 66 | 68 | A | A | A | A |
| 5 | CONWAY | 64 | 67 | 66 | A | A | A | A |
| 6 | LAKESIDE (Garland Co.) | 64 | 66 | 65 | A | A | A | A |
| 7 | MENA | 64 | 66 | 65 | A | A | A | A |
| 8 | BRYANT | 64 | 65 | 64 | A | A | A | A |
| 9 | SEARCY | 64 | 63 | 63 | A | A | A | A |
| 10 | SCRANTON | 75 | 66 | 58 | A | A | B | A- |
| 11 | VALLEY VIEW | 68 | 67 | 62 | A | A | B | A- |
| 12 | SALEM | 67 | 67 | 62 | A | A | B | A- |
| 13 | GREENWOOD | 68 | 66 | 60 | A | A | B | A- |
| 14 | MOUNTAINBURG | 64 | 58 | 72 | A | B | A | A- |
| 15 | DARDANELLE | 63 | 61 | 67 | A | B | A | A- |
| 16 | BISMARCK | 58 | 65 | 65 | B | A | A | A- |
| 17 | PARKERS CHAPEL | 64 | 63 | 55 | A | A | B | A- |
Districts with “B” Grades
| T-Scores | Letter Grades | |||||||
| Rank | District | Math | Reading | Adjustment | Math | Reading | Adjustment | Overall |
| 18 | BENTON | 67 | 60 | 62 | A | B | B | B+ |
| 19 | ARMOREL | 61 | 61 | 68 | B | B | A | B+ |
| 20 | GREENBRIER | 64 | 61 | 62 | A | B | B | B+ |
| 21 | VILONIA | 57 | 65 | 62 | B | A | B | B+ |
| 22 | HARRISON | 58 | 66 | 59 | B | A | B | B+ |
| 23 | BATESVILLE | 56 | 62 | 64 | B | B | A | B+ |
| 24 | NORFORK | 56 | 66 | 61 | B | A | B | B+ |
| 25 | GRAVETTE | 57 | 59 | 65 | B | B | A | B+ |
| 26 | SHERIDAN | 64 | 55 | 60 | A | B | B | B+ |
| 27 | BERGMAN | 63 | 56 | 57 | A | B | B | B+ |
| 28 | MOUNTAIN VIEW | 62 | 61 | 60 | B | B | B | B |
| 29 | MOUNTAIN HOME | 60 | 60 | 62 | B | B | B | B |
| 30 | PERRYVILLE | 61 | 58 | 63 | B | B | B | B |
| 31 | FARMINGTON | 60 | 60 | 61 | B | B | B | B |
| 32 | ROGERS | 60 | 60 | 61 | B | B | B | B |
| 33 | ARKADELPHIA | 62 | 60 | 58 | B | B | B | B |
Districts with “B” Grades (continued)
| T-Scores | Letter Grades | |||||||
| Rank | District | Math | Reading | Adjustment | Math | Reading | Adjustment | Overall |
| 34 | VALLEY SPRINGS | 60 | 61 | 58 | B | B | B | B |
| 35 | MCCRORY | 62 | 56 | 61 | B | B | B | B |
| 36 | SILOAM SPRINGS | 61 | 56 | 61 | B | B | B | B |
| 37 | JESSIEVILLE | 62 | 57 | 59 | B | B | B | B |
| 38 | WHITE HALL | 57 | 60 | 61 | B | B | B | B |
| 39 | HEBER SPRINGS | 61 | 58 | 59 | B | B | B | B |
| 40 | WONDERVIEW | 61 | 62 | 55 | B | B | B | B |
| 41 | PARIS | 61 | 59 | 58 | B | B | B | B |
| 42 | CABOT | 58 | 58 | 59 | B | B | B | B |
| 43 | CADDO HILLS | 60 | 58 | 58 | B | B | B | B |
| 44 | GREENE COUNTY TECH | 61 | 59 | 56 | B | B | B | B |
| 45 | BOONEVILLE | 57 | 60 | 57 | B | B | B | B |
| 46 | IZARD COUNTY CONS. | 55 | 58 | 61 | B | B | B | B |
| 47 | HUNTSVILLE | 62 | 54 | 58 | B | B | B | B |
| 48 | PEA RIDGE | 55 | 60 | 59 | B | B | B | B |
| 49 | BEEBE | 60 | 56 | 58 | B | B | B | B |
| 50 | MOUNTAIN PINE | 56 | 55 | 62 | B | B | B | B |
| 51 | EMERSON-TAYLOR | 61 | 54 | 58 | B | B | B | B |
| 52 | NEMO VISTA | 55 | 59 | 58 | B | B | B | B |
| 53 | VAN BUREN | 56 | 56 | 60 | B | B | B | B |
| 54 | SPRINGDALE | 57 | 56 | 57 | B | B | B | B |
| 55 | ELKINS | 64 | 48 | 58 | A | C | B | B |
| 56 | WESTSIDE CONS. | 55 | 56 | 59 | B | B | B | B |
| 57 | HARMONY GROVE (Ouachita) | 56 | 55 | 58 | B | B | B | B |
| 58 | MAYFLOWER | 54 | 54 | 60 | B | B | B | B |
| 59 | NETTLETON | 54 | 58 | 55 | B | B | B | B |
| 60 | RUSSELLVILLE | 54 | 55 | 55 | B | B | B | B |
| 61 | ALPENA | 53 | 61 | 62 | C | B | B | B- |
| 62 | GREENLAND | 51 | 61 | 61 | C | B | B | B- |
| 63 | MAGNET COVE | 58 | 53 | 61 | B | C | B | B- |
| 64 | STAR CITY | 60 | 53 | 59 | B | C | B | B- |
| 65 | MARION | 58 | 53 | 59 | B | C | B | B- |
| 66 | CLARKSVILLE | 62 | 55 | 54 | B | B | C | B- |
| 67 | EAST END | 53 | 56 | 61 | C | B | B | B- |
| 68 | JONESBORO | 54 | 52 | 61 | B | C | B | B- |
| 69 | VIOLA | 61 | 47 | 59 | B | C | B | B- |
| 70 | FOREMAN | 57 | 51 | 58 | B | C | B | B- |
| 71 | BUFFALO ISLAND CENTRAL | 57 | 53 | 56 | B | C | B | B- |
| 72 | GENOA CENTRAL | 56 | 57 | 53 | B | B | C | B- |
| 73 | HARMONY GROVE (Saline Co.) | 54 | 52 | 60 | B | C | B | B- |
| 74 | CHARLESTON | 58 | 49 | 56 | B | C | B | B- |
| 75 | LINCOLN | 54 | 52 | 57 | B | C | B | B- |
| 76 | MURFREESBORO | 52 | 56 | 56 | C | B | B | B- |
| 77 | YELLVILLE-S UMMIT | 52 | 55 | 56 | C | B | B | B- |
| 78 | EUREKA SPRINGS | 50 | 56 | 57 | C | B | B | B- |
Districts with “B” Grades (continued)
| T-Scores | Letter Grades | |||||||
| Rank | District | Math | Reading | Adjustment | Math | Reading | Adjustment | Overall |
| 79 | GENTRY | 55 | 51 | 56 | B | C | B | B- |
| 80 | SOUTH SIDE | 55 | 51 | 56 | B | C | B | B- |
| 81 | RECTOR | 53 | 54 | 55 | C | B | B | B- |
| 82 | FORT SMITH | 54 | 50 | 57 | B | C | B | B- |
| 83 | DEER/MT. JUDEA | 57 | 48 | 55 | B | C | B | B- |
| 84 | BAY | 51 | 56 | 54 | C | B | B | B- |
| 85 | LEAD HILL | 45 | 57 | 58 | C | B | B | B- |
| 86 | CALICO ROCK | 48 | 56 | 55 | C | B | B | B- |
| 87 | DECATUR | 45 | 51 | 63 | C | C | A | B- |
| 88 | CLINTON | 47 | 55 | 54 | C | B | B | B- |
| 89 | WOODLAWN | 54 | 55 | 44 | B | B | C | B- |
Districts with “C” Grades
| T-Scores | Letter Grades | |||||||
| Rank | District | Math | Reading | Adjustment | Math | Reading | Adjustment | Overall |
| 90 | MOUNT IDA | 56 | 52 | 54 | B | C | C | C+ |
| 91 | DOVER | 52 | 57 | 53 | C | B | C | C+ |
| 92 | MAGAZINE | 52 | 53 | 57 | C | C | B | C+ |
| 93 | BERRYVILLE | 54 | 53 | 53 | B | C | C | C+ |
| 94 | WESTSIDE | 50 | 51 | 59 | C | C | B | C+ |
| 95 | MT. VERNON/ENOLA | 58 | 52 | 49 | B | C | C | C+ |
| 96 | HOXIE | 52 | 54 | 53 | C | B | C | C+ |
| 97 | WYNNE | 55 | 51 | 52 | B | C | C | C+ |
| 98 | COUNTY LINE | 53 | 56 | 50 | C | B | C | C+ |
| 99 | OUACHITA | 56 | 48 | 53 | B | C | C | C+ |
| 100 | OZARK | 51 | 56 | 51 | C | B | C | C+ |
| 101 | DANVILLE | 50 | 52 | 55 | C | C | B | C+ |
| 102 | HIGHLAND | 52 | 50 | 55 | C | C | B | C+ |
| 103 | CONCORD | 50 | 56 | 52 | C | B | C | C+ |
| 104 | CLEVELAND COUNTY | 55 | 51 | 50 | B | C | C | C+ |
| 105 | JASPER | 52 | 56 | 48 | C | B | C | C+ |
| 106 | ALMA | 50 | 56 | 50 | C | B | C | C+ |
| 107 | MARKED TREE | 52 | 48 | 55 | C | C | B | C+ |
| 108 | POYEN | 55 | 47 | 52 | B | C | C | C+ |
| 109 | MANILA | 55 | 46 | 53 | B | C | C | C+ |
| 110 | GURDON | 56 | 42 | 54 | B | C | C | C+ |
| 111 | OUACHITA RIVER | 47 | 51 | 54 | C | C | B | C+ |
| 112 | SOUTHSIDE | 51 | 56 | 45 | C | B | C | C+ |
| 113 | MALVERN | 48 | 49 | 54 | C | C | B | C+ |
| 114 | BRADLEY | 60 | 46 | 45 | B | C | C | C+ |
| 115 | WALDRON | 47 | 48 | 54 | C | C | B | C+ |
| 116 | GUY-PERKINS | 54 | 47 | 48 | B | C | C | C+ |
| 117 | COTTER | 54 | 51 | 43 | B | C | C | C+ |
| 118 | STUTTGART | 48 | 45 | 56 | C | C | B | C+ |
| 119 | KIRBY | 45 | 54 | 49 | C | B | C | C+ |
| 120 | CUSHMAN | 46 | 43 | 56 | C | C | B | C+ |
Districts with “C” Grades (continued)
| T-Scores | Letter Grades | |||||||
| Rank | District | Math | Reading | Adjustment | Math | Reading | Adjustment | Overall |
| 121 | OMAHA | 45 | 58 | 42 | C | B | C | C+ |
| 122 | HECTOR | 48 | 54 | 43 | C | B | C | C+ |
| 123 | MAMMOTH SPRING | 43 | 56 | 45 | C | B | C | C+ |
| 124 | LAMAR | 52 | 52 | 53 | C | C | C | C |
| 125 | CEDARVILLE | 51 | 52 | 52 | C | C | C | C |
| 126 | FOUNTAIN LAKE | 51 | 53 | 51 | C | C | C | C |
| 127 | MONTICELLO | 52 | 50 | 53 | C | C | C | C |
| 128 | GLEN ROSE | 50 | 53 | 51 | C | C | C | C |
| 129 | MANSFIELD | 51 | 51 | 51 | C | C | C | C |
| 130 | GOSNELL | 51 | 49 | 52 | C | C | C | C |
| 131 | JACKSON COUNTY | 53 | 48 | 50 | C | C | C | C |
| 132 | BAUXITE | 49 | 52 | 50 | C | C | C | C |
| 133 | DES ARC | 53 | 46 | 52 | C | C | C | C |
| 134 | CENTERPOINT | 51 | 50 | 50 | C | C | C | C |
| 135 | WEINER | 49 | 51 | 50 | C | C | C | C |
| 136 | WEST SIDE | 50 | 52 | 48 | C | C | C | C |
| 137 | LONOKE | 47 | 51 | 51 | C | C | C | C |
| 138 | ATKINS | 53 | 49 | 47 | C | C | C | C |
| 139 | CAMDEN-FAIRVIEW | 50 | 47 | 51 | C | C | C | C |
| 140 | SOUTH CONWAY COUNTY | 51 | 49 | 47 | C | C | C | C |
| 141 | BRADFORD | 53 | 47 | 47 | C | C | C | C |
| 142 | WEST FORK | 48 | 50 | 49 | C | C | C | C |
| 143 | WICKES | 50 | 47 | 49 | C | C | C | C |
| 144 | FOUKE | 48 | 48 | 50 | C | C | C | C |
| 145 | MULBERRY | 50 | 42 | 53 | C | C | C | C |
| 146 | POCAHONTAS | 50 | 50 | 46 | C | C | C | C |
| 147 | ASHDOWN | 50 | 48 | 47 | C | C | C | C |
| 148 | LAWRENCE COUNTY | 44 | 51 | 49 | C | C | C | C |
| 149 | TWIN RIVERS | 47 | 45 | 52 | C | C | C | C |
| 150 | TWO RIVERS | 46 | 49 | 48 | C | C | C | C |
| 151 | MELBOURNE | 46 | 56 | 42 | C | B | D | C |
| 152 | SPRING HILL | 55 | 41 | 47 | B | D | C | C |
| 153 | HAMPTON | 46 | 47 | 49 | C | C | C | C |
| 154 | CAVE CITY | 48 | 50 | 45 | C | C | C | C |
| 155 | DEWITT | 51 | 46 | 46 | C | C | C | C |
| 156 | EAST POINSETT COUNTY | 48 | 43 | 51 | C | C | C | C |
| 157 | NEWPORT | 45 | 46 | 51 | C | C | C | C |
| 158 | NASHVILLE | 48 | 47 | 47 | C | C | C | C |
| 159 | HACKETT | 49 | 46 | 47 | C | C | C | C |
| 160 | MIDLAND | 51 | 49 | 42 | C | C | C | C |
| 161 | PIGGOTT | 46 | 53 | 43 | C | C | C | C |
| 162 | PARAGOULD | 48 | 46 | 48 | C | C | C | C |
| 163 | WESTERN YELL COUNTY | 47 | 46 | 48 | C | C | C | C |
| 164 | PANGBURN | 47 | 51 | 43 | C | C | C | C |
| 165 | RIVERVIEW | 47 | 51 | 43 | C | C | C | C |
Districts with “C” Grades (continued)
| T-Scores | Letter Grades | |||||||
| Rank | District | Math | Reading | Adjustment | Math | Reading | Adjustment | Overall |
| 166 | OZARK MOUNTAIN | 47 | 46 | 47 | C | C | C | C |
| 167 | CUTTER-MORNING STAR | 45 | 51 | 44 | C | C | C | C |
| 168 | BARTON-LEXA | 44 | 50 | 45 | C | C | C | C |
| 169 | WHITE COUNTY CENTRAL | 47 | 49 | 43 | C | C | C | C |
| 170 | GREEN FOREST | 48 | 44 | 46 | C | C | C | C |
| 171 | ROSE BUD | 43 | 48 | 47 | C | C | C | C |
| 172 | HAMBURG | 50 | 43 | 44 | C | C | C | C |
| 173 | MAYNARD | 45 | 45 | 48 | C | C | C | C |
| 174 | HORATIO | 46 | 47 | 43 | C | C | C | C |
| 175 | DIERKS | 44 | 47 | 46 | C | C | C | C |
| 176 | SEARCY COUNTY | 48 | 45 | 43 | C | C | C | C |
| 177 | HAZEN | 45 | 47 | 42 | C | C | C | C |
| 178 | HOT SPRINGS | 49 | 42 | 43 | C | C | C | C |
| 179 | EL DORADO | 44 | 42 | 45 | C | C | C | C |
| 180 | CARLISLE | 45 | 43 | 43 | C | C | C | C |
| 181 | NORTH LITTLE ROCK | 43 | 42 | 44 | C | C | C | C |
| 182 | WARREN | 50 | 41 | 49 | C | D | C | C- |
| 183 | HILLCREST | 48 | 51 | 41 | C | C | D | C- |
| 184 | SMACKOVER | 42 | 48 | 48 | D | C | C | C- |
| 185 | MAGNOLIA | 48 | 41 | 48 | C | D | C | C- |
| 186 | WATSON CHAPEL | 41 | 46 | 49 | D | C | C | C- |
| 187 | LAVACA | 38 | 51 | 44 | D | C | C | C- |
| 188 | CEDAR RIDGE | 42 | 47 | 45 | D | C | C | C- |
| 189 | TRUMANN | 46 | 41 | 47 | C | D | C | C- |
| 190 | FLIPPIN | 36 | 51 | 45 | D | C | C | C- |
| 191 | SOUTH MISSISSIPPI COUNTY | 47 | 37 | 49 | C | D | C | C- |
| 192 | MCGEHEE | 46 | 47 | 40 | C | C | D | C- |
| 193 | PRAIRIE GROVE | 46 | 47 | 38 | C | C | D | C- |
| 194 | DEQUEEN | 47 | 40 | 43 | C | D | C | C- |
| 195 | JUNCTION CITY | 43 | 48 | 39 | C | C | D | C- |
| 196 | PRESCOTT | 47 | 42 | 41 | C | C | D | C- |
| 197 | CROSS COUNTY | 41 | 45 | 43 | D | C | C | C- |
| 198 | BALD KNOB | 47 | 43 | 39 | C | C | D | C- |
| 199 | LITTLE ROCK | 40 | 43 | 45 | D | C | C | C- |
| 200 | DREW CENTRAL | 42 | 43 | 43 | D | C | C | C- |
| 201 | BEARDEN | 37 | 42 | 47 | D | C | C | C- |
| 202 | NORPHLET | 47 | 45 | 34 | C | C | D | C- |
| 203 | BLEVINS | 40 | 42 | 44 | D | C | C | C- |
| 204 | PULASKI COUNTY SPECIAL | 38 | 43 | 43 | D | C | C | C- |
| 205 | QUITMAN | 44 | 45 | 35 | C | C | D | C- |
| 206 | FORDYCE | 37 | 42 | 44 | D | C | C | C- |
Districts with “D” Grades
| T-Scores | Letter Grades | |||||||
| Rank | District | Math | Reading | Adjustment | Math | Reading | Adjustment | Overall |
| 207 | RIVERSIDE | 36 | 52 | 40 | D | C | D | D+ |
| 208 | VAN COVE | 42 | 42 | 41 | D | C | D | D+ |
| 209 | BROOKLAND | 42 | 46 | 37 | D | C | D | D+ |
| 210 | DUMAS | 40 | 39 | 45 | D | D | C | D+ |
| 211 | HARRISBURG | 44 | 41 | 34 | C | D | D | D+ |
| 212 | SLOAN-HENDRIX | 38 | 42 | 39 | D | C | D | D+ |
| 213 | HARTFORD | 43 | 39 | 36 | C | D | D | D+ |
| 214 | ENGLAND | 42 | 38 | 40 | D | D | D | D |
| 215 | TEXARKANA | 41 | 36 | 40 | D | D | D | D |
| 216 | BRINKLEY | 44 | 34 | 39 | C | F | D | D |
| 217 | CORNING | 42 | 38 | 35 | D | D | D | D |
| 218 | HOPE | 37 | 39 | 38 | D | D | D | D |
| 219 | CROSSETT | 37 | 41 | 36 | D | D | D | D |
| 220 | NEVADA COUNTY | 36 | 35 | 40 | D | D | D | D |
| 221 | PINE BLUFF | 31 | 34 | 42 | F | D | C | D |
| 222 | MINERAL SPRINGS | 33 | 36 | 41 | F | D | D | D- |
| 223 | WEST MEMPHIS | 36 | 34 | 38 | D | F | D | D- |
| 224 | LEE COUNTY | 35 | 30 | 41 | D | F | D | D- |
| 225 | OSCEOLA | 32 | 34 | 39 | F | D | D | D- |
| 226 | MARVELL | 36 | 30 | 37 | D | F | D | D- |
| 227 | STRONG-HUTTIG | 29 | 34 | 37 | F | D | D | D- |
| 228 | BLYTHEVILLE | 34 | 32 | 35 | D | F | D | D- |
| 229 | LAFAYETTE COUNTY | 35 | 27 | 34 | D | F | D | D- |
| 230 | PALESTINE/WHEATLEY | 32 | 33 | 39 | F | F | D | D- |
| 231 | MARMADUKE | 32 | 40 | 30 | F | D | F | D- |
| 232 | STEPHENS | 33 | 28 | 38 | F | F | D | D- |
| 233 | CLARENDON | 29 | 38 | 29 | F | D | F | D- |
| 234 | LAKESIDE (Chicot Co.) | 38 | 27 | 27 | D | F | F | D- |
| 235 | DELIGHT | 22 | 39 | 19 | F | D | F | D- |
Districts with “F” Grades
| T-Scores | Letter Grades | |||||||
| Rank | District | Math | Reading | Adjustment | Math | Reading | Adjustment | Overall |
| 236 | FORREST CITY | 31 | 24 | 33 | F | F | F | F |
| 237 | DERMOTT | 29 | 26 | 32 | F | F | F | F |
| 238 | AUGUSTA | 26 | 32 | 29 | F | F | F | F |
| 239 | HELENA/W. HELENA | 32 | 27 | 24 | F | F | F | F |
| 240 | TURRELL | 27 | 28 | 26 | F | F | F | F |
| 241 | EARLE | 26 | 26 | 25 | F | F | F | F |
| 242 | HUGHES | 20 | 27 | 29 | F | F | F | F |
| 243 | DOLLARWAY | 25 | 24 | 24 | F | F | F | F |
| 244 | HERMITAGE | 26 | 17 | 14 | F | F | F | F |
The following districts did not report SAT-10 results for the 1st grade, which were necessary for calculating “Adjustment” grades. Letter grades in 9th-Grade Reading and Math are reported.
| T-Scores | Letter Grades | |||||||
| Rank | District | Math | Reading | Adjustment | Math | Reading | Adjustment | Overall |
| 1 | HAAS HALL ACADEMY | 72 | 82 | n/a | A | A | n/a | n/a |
| 2 | LISA ACADEMY | 77 | 73 | n/a | A | A | n/a | n/a |
| 3 | NWA ACADEMY FINE ART | 60 | 74 | n/a | B | A | n/a | n/a |
| 4 | KIPP DELTA COLLEGE PREP | 67 | 60 | n/a | A | B | n/a | n/a |
| 5 | ACADEMICS PLUS | 46 | 49 | n/a | C | C | n/a | n/a |
| 6 | SHIRLEY | 47 | 47 | n/a | C | C | n/a | n/a |
Letter Grades and District Characteristics
Demographic and economic characteristics of the communities within which districts operate were not explicitly used in assigning letter grades. However, the relationships of the se characteristics to the assigned letter grades were examined, revealing some expected and some surprising patterns.
Poverty and Adult Educational Levels
Compared to the best districts, the poorest-performing districts have approximately double the percentage of students eligible for free or reduced lunch, double the percentage of single-parent households, and half the percentage of adults with a minimum of a 4- year bachelor’s degree. The percentage of adults with at least a high-school education was also directly related to district performance.
Table 2: District Averages for Indicators of Poverty and Adult Education
|
Grade |
% Free
or Reduced Lunch |
% Single- Parent Households |
% Adults with High-
School Education |
% Adults with 4-
year Degree |
| A | 48 | 10 | 87 | 23 |
| A- | 43 | 10 | 81 | 15 |
| B+ | 42 | 9 | 84 | 17 |
| B | 51 | 10 | 81 | 15 |
| B- | 53 | 11 | 79 | 14 |
| C+ | 62 | 10 | 76 | 11 |
| C | 59 | 10 | 77 | 12 |
| C- | 60 | 12 | 77 | 14 |
| D+ | 60 | 12 | 76 | 10 |
| D | 72 | 14 | 75 | 13 |
| D- | 80 | 16 | 72 | 10 |
| F | 95 | 19 | 68 | 10 |
Geographic Characteristics
Data presented in Table 3 indicate that districts in sparsely-populated areas face challenges in educating students. The general trend is that as student density (students per square mile) decreases, so does district performance.
Table 3: Averages for District Geographic Characteristics
| Grade | Square
Miles |
Enrollment | Student
Density |
| A | 221 | 5315 | 39 |
| A- | 147 | 1384 | 10 |
| B+ | 182 | 2377 | 16 |
| B | 220 | 2937 | 21 |
| B- | 159 | 1603 | 20 |
| C+ | 224 | 1002 | 7 |
| C | 220 | 1379 | 14 |
| C- | 261 | 2845 | 17 |
| D+ | 156 | 904 | 6 |
| D | 240 | 2181 | 10 |
| D- | 286 | 1333 | 10 |
| F | 257 | 1273 | 6 |
Geographic characteristics that are related to district performance are also apparent from considering the percentage of districts within each of the state’s Education Service Cooperatives that received grades in the A/B range and in the D/F range. Educational cooperatives are discussed more thoroughly in a previous report from the Arkansas Policy Foundation (Murphy Commission, 1998). The accompanying map identifies those cooperatives that had percentages of districts greater than the state percentages in the A/B and D/F ranges.
Three cooperatives were ambiguous. Pulaski County Schools had percentages above the state values in both ranges. DeQueen/Mena and Wilbur Mills had percentages below the state values in both ranges. Nonetheless, the oft-cited line running the southwest to the northeast corner of the state is predictive of performance.
Cooperatives above the line serve high percentage of A/B districts. Those below the line serve a high percentageof D/F districts. Other than the three “ambiguous” cooperatives, the only exceptions are the Dawson and Western Arkansas cooperatives. The actual percentages for each cooperative are presented in Table 4.
District Expenditures
Table 4: Percent of Districts within each Cooperative Assigned A/B and D/F Grades
| Cooperative Name | A/B | D/F |
| Arch Ford Education Service Coop | 56 | 4 |
| Arkansas River Education Coop | 29 | 29 |
| Crowley’s Ridge Education Coop | 30 | 30 |
| Dawson Education Service Coop | 45 | 5 |
| DeQueen/Mena Education Coop | 21 | 14 |
| Great Rivers Coop | 0 | 88 |
| Northcentral Arkansas Education Coop | 44 | 0 |
| Northeast Arkansas Education Coop | 8 | 17 |
| Northwest Arkansas Education Service Coop | 88 | 0 |
| Ozarks Unlimited Resource Coop | 41 | 0 |
| Pulaski County Schools | 50 | 25 |
| South Central Arkansas Educ. Coop | 18 | 18 |
| Southeast Service Coop | 15 | 46 |
| Southwest Arkansas Education Coop | 11 | 33 |
| Western Arkansas Coop | 41 | 7 |
| Wilbur Mills Education Coop | 35 | 12 |
| STATE | 36 | 16 |
It is generally assumed that higher teacher salaries are related to the ability to recruit the most effective teachers, and therefore should be related to better student performance. Table 5 suggests that this is especially true when considering the top-performing schools from this evaluation. The highest average salaries (approximately
$48,000) were seen in the districts assigned an “A”. The lowest (approximately $39,000) were seen in those districts assigned a “D+”. However, those assigned a grade of “F” had higher average salaries than all but 3 of the other 11 letter- grade groups.
Table 5: Averages for District Expenditures
|
Grade |
Average Teacher Salaries | Per Pupil Expenditures
(Total) |
Per Pupil Expenditures (Instructional) |
Percent Instructional |
| A | $47,980 | $7,861 | $4,928 | 63 |
| A- | $42,105 | $7,460 | $4,654 | 62 |
| B+ | $44,479 | $7,608 | $4,766 | 63 |
| B | $42,786 | $7,779 | $4,830 | 62 |
| B- | $41,220 | $8,192 | $5,035 | 61 |
| C+ | $39,806 | $8,052 | $5,166 | 64 |
| C | $40,714 | $8,100 | $4,983 | 62 |
| C- | $40,531 | $8,479 | $5,198 | 61 |
| D+ | $39,035 | $8,119 | $5,093 | 63 |
| D | $41,456 | $8,653 | $5,276 | 61 |
| D- | $41,252 | $9,265 | $5,600 | 60 |
| F | $42,201 | $9,740 | $5,807 | 60 |
The poorest-performing districts were the least economical in terms of both total per-pupil expenditures and instructional per-pupil expenditures. When instructional expenditures are expressed as a percentage of total expenditures, this percentage is slightly lower in the poorest-performing districts.
Loss of Students
Students may leave a district for a number of reasons. Those reported by the Arkansas Department of Education include moving to another district, incarceration, death, or a number of personal issues (e.g., difficulty with peers, marriage, pregnancy). Table 6 provides information on student attrition due to moving, incarceration and dropouts/withdrawals for reasons other than moving, incarceration, or death. There is no apparent pattern relating district performance to the percentage of students that move to another district. The relationshipbetween district performance and other reasons for leaving the district is disturbing. Although the percentage of students who are incarcerated is small in absolute terms, the risk of incarceration for students in districtsassigned a grade of “F” was at least twice as great as for any other category—a finding which clearly warrants further study. Students in districts assigned grades of “D” or “F” also had a greater risk for dropping out or withdrawing from school for other reasons.
Table 6: District Averages Related to Student Attrition
|
Grade |
% Moving Out of District |
% Students Incarcerated |
% Dropouts and Withdrawals |
| A | 2.66 | 0.05 | 1.06 |
| A- | 3.16 | 0.01 | 0.61 |
| B+ | 2.69 | 0.02 | 0.89 |
| B | 2.96 | 0.04 | 0.97 |
| B- | 3.23 | 0.03 | 0.93 |
| C+ | 3.88 | 0.02 | 0.91 |
| C | 3.94 | 0.03 | 0.96 |
| C- | 3.06 | 0.03 | 1.27 |
| D+ | 3.14 | 0.00 | 1.40 |
| D | 3.41 | 0.03 | 1.18 |
| D- | 2.89 | 0.06 | 1.67 |
| F | 3.47 | 0.12 | 2.06 |
Instructional Materials – State-Approved Lists
School districts may select their own instructional materials or choose materials that are available from a state- approved list (A.C.A. § 6-21-403). Requests for materials from the state-approved list for various content areas are made on a staggered, six- year cycle. The most recent requests for English/Language Arts and for Mathematics were made in 2005 and 2006, respectively. Although the list of specific materials available from the state-approved list is lengthy, the requests from individual districts cite publishers and grade levels. The Arkansas Department of Education’s Office of Curriculum, Assessment, and Research provided the author of this report with summaries of requests made by Arkansas school districts in 2005 and 2006. These summaries were examined for districts that, in this report, received grades of “A” in reading or math. The publishers of instructional materials that were requested were noted separately for grades K-8 and 9-12.
The selection of instructional materials in English/Language Arts, by publisher, are reported in Table 7 for districts receiving grades of “A” in reading, based on 9th-grade SAT-10 reading performance (17 districts). Because districts could request materials by more that one publisher, the totals exceed 100% at both grade ranges. Materials published by Macmillan/McGraw-Hill and Harcourt School Publishers were tied as the most popular for grades K-8. Perhaps the most striking finding for grades 9-12 was that the majority of “A” districts (9 of 17) did not choose their materials from the state adoption list.
Table 7: Grades K-8 English/Language Arts Percentage of “A” (Reading) Districts Requesting Materials
from Various Publishers
| Publisher | Grades K-8 | Grades 9-12 |
| Macmillan/McGraw-Hill | 41 | |
| Holt,Rinehart & Winston | 35 | 24 |
| Harcourt School Publishers |
41 |
|
| Great Source Edu. Group | 18 | 6 |
| Prentice Hall | 18 | 18 |
| Houghton Mifflin | 18 | |
| Glencoe/McGraw-Hill | 12 | 12 |
| None Requested | 6 | 53 |
The selection of instructional materials in Mathematics, by publisher, are reported in Table 8 for districts receiving grades of “A” in math, based on 9th-grade SAT-10 math performance (21 districts). Materials published by Prentice Hall and Harcourt School Publishers were tied as the most popular for the “A” districts for grades K-8. For grades 9-12, materials from Prentice Hall were chosen most frequently, followed by McDougal Littell. Contrary to what was seen in the English/Language Arts area, all 21 districts requested instructional materials for mathematics from the state-approved list in grades 9-12.
Table 8: Grades K-8 Mathematics
Percentage of “A” (Math) Districts Requesting Materials from Various Publishers
| Publisher | Grades K-8 | Grades 9-12 |
| Prentice Hall | 38 | 76 |
| Harcourt School Publishers | 38 | |
| Wright Group | 33 | |
| Glencoe/McGraw-Hill | 24 | 48 |
| Holt,Rinehart & Winston | 19 | 14 |
| Scott Foresman | 29 | |
| McDougal Littell | 19 | 67 |
| Great Source Edu. Group | 5 | |
| Thomson Learning | 24 | |
| None Requested | 10 | 0 |
Instructional Materials – “What Works Clearing House”
The U.S. Department of Education’s Institute of Education Sciences, “What Works Clearinghouse” (WWC) provides information on scientific evidence regarding effectiveness of a number of instructional programs in
several subject areas. The nine districts that received overall “A” grades were invited to respond to a survey on use of WWC-identified programs. Although WWC does not make recommendations regarding instructional materials, it does provide an “evidence rating” for programs determined by evaluation of research on four factors: quality of the research design, statistical significance, effect size, and consistency of findings across studies.
Of the nine districts were asked to participate in the survey, four responded. Although obviously a small sample,the results of the survey are reported in Table 9. Only those instructional programs that received WWC evidence ratings indicative of “positive” or “potentially positive ” effects are reported.
Table 9: Use of Instructional Materials Identified by “What Works Clearing House” for 4 of 9 Districts receiving an Overall “A” grade.
|
Area/Program |
# of Districts |
“What Works Clearing House” Evidence Rating |
| Early Childhood Education | ||
| Phonological Awareness Training | 3 | Positive Effects |
| Shared Book Reading | 3 | Potentially Positive Effects |
| Phonological Awareness Training + Letter Knowledge Training | 2 | Potentially Positive Effects |
| Beginning Reading | ||
| Accelerated Reader/Reading Renaissance | 4 | Potentially Positive Effects |
| Reading Recovery® | 2 | Positive Effects |
| Peer-Assisted Learning Strategies (PALS) | 2 | Potentially Positive Effects |
| ClassWide Peer Tutoring | 1 | Potentially Positive Effects |
| Earobics® | 1 | Positive/Potentially Positive Effects |
| Fluency Formula™ | 1 | Potentially Positive Effects |
| English Language Learners | ||
| Peer Tutoring and Response Groups | 1 | Positive Effects |
| Instructional Conversations and Literature Logs | 1 | Potentially Positive Effects |
| Reading Mastery / SRA / McGraw-Hill | 1 | Potentially Positive Effects |
| Elementary School Math | ||
| Everyday Mathematics | 2 | Potentially Positive Effects |
| Character Education | ||
| Too Good for Drugs and Violence (TGFD & V) | 1 | Positive Effects |
| Positive Action | 1 | Positive Effects |
| Too Good For Violence (TGFV) | 1 | Potentially Positive Effects |
| Building Decision Skills | 1 | Potentially Positive Effects |
| Dropout Prevention | ||
| Talent Search | 2 | Potentially Positive Effects |
| Career Academies | 1 | Potentially Positive Effects |
| Job Corps | 1 | Potentially Positive Effects |
Sources of Data Used for this Report
Results of 2008 SAT-10 Administration
Arkansas Department of Education – http://arkansased.org/testing/excel/sat10_district_08.xls
Adult Educational Levels; Single-Parent Households
SchoolDataDirect – http://www.schooldatadirect.org/
Area in Square Miles; District Expenditures
Arkansas Public Computer Network Annual Statistical Reports – http://www.apscn.org/reports/caja/asr/asr.htm
Enrollments; Free or Reduced Lunch; Dropouts & Withdrawals; Districts by Education Service Cooperatives
Arkansas Department of Education Data Center – http://adedata.arkans as.gov/
Instructional Materials
Arkansas Department of Education, Office of Curriculum, Assessment, and Research – http://arkansased.org/teachers/instructional_material.html
“What Works Clearing House”, Institute of Education Sciences, U.S. Department of Education – http://ies.ed.gov/ncee/wwc/
Map of Education Service Cooperatives
Arkansas Department of Education – http://www.arkansased.org/schools/schools_coops.html
References
Arkansas Policy Foundation. (2006). Arkansas 2004-05 School District Rankings. [Available online at http://www.reformarkansas.org/policy/ARKANSAS.pdf]
Arkansas Policy Foundaton. (2007). Arkansas 2005-06 School District Rankings. [Available online at https://www.arkansaspolicyfoundation.org/policy/2005-2006_school_district_rankings.pdf]
Arkansas Policy Foundation. (2008). Arkansas 2006-07 School District Rankings. [Summary available online at https://www.arkansaspolicyfoundation.org/policy/ar_06-07_school_district_rankings.html]
Coleman, J. S., et al. (1966). Equality of educational opportunity. US Office of Education. Washington, DC: USGPO.
Ensminger, M. & Slusarcick, A. (1992). Paths to high school graduation or dropout: A longitudinal study of a first-grade cohort. Sociology of Education, 65, 95-113.
Green, J. P., Barnett, J. H., Ritter, G. W., & Winters, M. A. (2006). The School Performance Index in Arkansas. Department of Education Reform, University of Arkansas.
Glass, G. V. & Hopkins, K. D. (1996). Statistical methods in psychology and education (3rd ed.). Boston: Allyn and Bacon.
Murphy Commission. (1998). Streamlining and Cost-Saving Opportunities in Arkansas’ K-12 Public Education System. [Available online at http://www.reformarkansas.org]
Sutton, A. & Soderstrom, I. (1999). Predicting elementary and secondary school achievement with school- related and demographic factors. Journal of Educational Research, 92, 330-338.
Tabachnick, B. G., & Fidell, L. S. (2007). Using multivariate statistics (5th ed.). Boston: Allyn and Bacon.
Appendix: Detailed Description of Assignment of Letter Grades, by District Math and Reading Letter Grades
District
ACADEMICS PLUS 57 46 51.76 49.00 45.59 49.06 C C
ALMA 61 55 52.79 51.26 49.72 56.35 C B
ALPENA 64 61 53.58 52.79 52.90 61.31 C B
ARKADELP HIA 72 59 55.83 52.28 61.92 59.64 B B
ARMOREL 71 61 55.53 52.79 60.74 61.31 B B
ASHDOWN 61 45 52.79 48.74 49.72 48.25 C C
ATKINS 64 46 53.58 49.00 52.90 49.06 C C
AUGUSTA 38 26 46.95 43.57 26.22 31.55 F F
BALD KNOB 58 39 52.02 47.21 46.61 43.29 C C
BARTON-LEXA 55 47 51.26 49.25 43.55 49.87 C C
BATESVILLE 67 62 54.40 53.05 56.18 62.15 B B
BAUXITE 60 50 52.53 50.00 48.68 52.30 C C
BAY 62 54 53.05 51.00 50.77 55.54 C B
BEARDEN 49 38 49.75 46.95 37.49 42.45 D C
BEEBE 70 54 55.24 51.00 59.57 55.54 B B
BENTON 76 60 57.06 52.53 66.88 60.47 A B
BENTONVILLE 78 70 57.72 55.24 69.53 69.21 A A
BERGMAN 73 54 56.13 51.00 63.12 55.54 A B
BERRYVILLE 65 51 53.85 50.25 53.98 53.11 B C
BISMARCK 69 65 54.96 53.85 58.42 64.73 B A
BLEVINS 51 37 50.25 46.68 39.51 41.60 D C
BLYTHEVILLE 46 26 49.00 43.57 34.46 31.55 D F
BOONEVILLE 68 59 54.68 52.28 57.29 59.64 B B
BRADFORD 64 43 53.58 48.24 52.90 46.61 C C
BRADLEY 70 42 55.24 47.98 59.57 45.79 B C
BRINKLEY 55 28 51.26 44.17 43.55 33.50 C F
BROOKLAND 53 42 50.75 47.98 41.52 45.79 D C
BRYANT 74 65 56.43 53.85 64.35 64.73 A A
BUFFALO ISLAND CENTR 68 51 54.68 50.25 57.29 53.11 B C
CABOT 69 57 54.96 51.76 58.42 57.99 B B
CADDO HILLS 70 57 55.24 51.76 59.57 57.99 B B
CALICO ROCK 59 55 52.28 51.26 47.64 56.35 C B
CAMDEN-FAIRVIEW 61 43 52.79 48.24 49.72 46.61 C C
| CARLISLE | 56 | 39 | 51.51 | 47.21 | 44.57 | 43.29 | C | C |
| CAVE CITY | 59 | 47 | 52.28 | 49.25 | 47.64 | 49.87 | C | C |
| CEDAR RIDGE | 53 | 43 | 50.75 | 48.24 | 41.52 | 46.61 | D | C |
| CEDARVILLE | 62 | 50 | 53.05 | 50.00 | 50.77 | 52.30 | C | C |
| CENTERPOINT | 62 | 47 | 53.05 | 49.25 | 50.77 | 49.87 | C | C |
| CHARLESTON | 69 | 46 | 54.96 | 49.00 | 58.42 | 49.06 | B | C |
| CLARENDON | 41 | 33 | 47.72 | 45.60 | 29.36 | 38.11 | F | D |
| CLARKSVILLE | 72 | 53 | 55.83 | 50.75 | 61.92 | 54.73 | B | B |
| CLEVELAND COUNTY | 66 | 48 | 54.12 | 49.50 | 55.07 | 50.68 | B | C |
| CLINTON | 58 | 53 | 52.02 | 50.75 | 46.61 | 54.73 | C | B |
| CONCORD | 61 | 54 | 52.79 | 51.00 | 49.72 | 55.54 | C | B |
| CONWAY | 74 | 68 | 56.43 | 54.68 | 64.35 | 67.39 | A | A |
| CORNING | 53 | 33 | 50.75 | 45.60 | 41.52 | 38.11 | D | D |
| COTTER | 65 | 49 | 53.85 | 49.75 | 53.98 | 51.49 | B | C |
| COUNTY LINE | 64 | 54 | 53.58 | 51.00 | 52.90 | 55.54 | C | B |
| CROSS COUNTY | 52 | 41 | 50.50 | 47.72 | 40.51 | 44.96 | D | C |
| CROSSETT | 49 | 36 | 49.75 | 46.42 | 37.49 | 40.74 | D | D |
| CUSHMAN | 57 | 39 | 51.76 | 47.21 | 45.59 | 43.29 | C | C |
| CUTTER-MRG.STAR | 56 | 48 | 51.51 | 49.50 | 44.57 | 50.68 | C | C |
| DANVILLE | 61 | 50 | 52.79 | 50.00 | 49.72 | 52.30 | C | C |
| DARDANELLE | 73 | 61 | 56.13 | 52.79 | 63.12 | 61.31 | A | B |
| DECATUR | 56 | 48 | 51.51 | 49.50 | 44.57 | 50.68 | C | C |
| DEER/MT. JUDEA | 68 | 45 | 54.68 | 48.74 | 57.29 | 48.25 | B | C |
| DELIGHT | 34 | 34 | 45.88 | 45.88 | 21.92 | 39.00 | F | D |
| DEQUEEN | 58 | 35 | 52.02 | 46.15 | 46.61 | 39.87 | C | D |
| DERMOTT | 41 | 21 | 47.72 | 41.94 | 29.36 | 26.29 | F | F |
| DES ARC | 64 | 42 | 53.58 | 47.98 | 52.90 | 45.79 | C | C |
| DEWITT | 62 | 42 | 53.05 | 47.98 | 50.77 | 45.79 | C | C |
| DIERKS | 55 | 43 | 51.26 | 48.24 | 43.55 | 46.61 | C | C |
| DOLLARWAY | 37 | 19 | 46.68 | 41.22 | 25.16 | 23.98 | F | F |
| DOVER | 63 | 56 | 53.32 | 51.51 | 51.83 | 57.17 | C | B |
| DREW CENTRAL | 53 | 39 | 50.75 | 47.21 | 41.52 | 43.29 | D | C |
| DUMAS | 51 | 34 | 50.25 | 45.88 | 39.51 | 39.00 | D | D |
| EARLE | 38 | 21 | 46.95 | 41.94 | 26.22 | 26.29 | F | F |
| EAST END | 64 | 54 | 53.58 | 51.00 | 52.90 | 55.54 | C | B |
| EAST POINSETT COUNTY | 59 | 39 | 52.28 | 47.21 | 47.64 | 43.29 | C | C |
| EL DORADO | 55 | 38 | 51.26 | 46.95 | 43.55 | 42.45 | C | C |
| ELKINS | 74 | 45 | 56.43 | 48.74 | 64.35 | 48.25 | A | C |
| EMERSON-TAYLOR | 71 | 52 | 55.53 | 50.50 | 60.74 | 53.92 | B | B |
| ENGLAND | 53 | 33 | 50.75 | 45.60 | 41.52 | 38.11 | D | D |
| EUREKA | 61 | 54 | 52.79 | 51.00 | 49.72 | 55.54 | C | B |
| FARMINGTON | 70 | 60 | 55.24 | 52.53 | 59.57 | 60.47 | B | B |
| FAYETTEVILLE | 76 | 67 | 57.06 | 54.40 | 66.88 | 66.49 | A | A |
| FLIPPIN | 48 | 49 | 49.50 | 49.75 | 36.48 | 51.49 | D | C |
| FORDYCE | 49 | 37 | 49.75 | 46.68 | 37.49 | 41.60 | D | C |
| FOREMAN | 68 | 49 | 54.68 | 49.75 | 57.29 | 51.49 | B | C |
| FORREST CITY | 43 | 19 | 48.24 | 41.22 | 31.41 | 23.98 | F | F |
| FORT SMITH | 65 | 47 | 53.85 | 49.25 | 53.98 | 49.87 | B | C |
| FOUKE | 59 | 45 | 52.28 | 48.74 | 47.64 | 48.25 | C | C |
| FOUNTAIN LAKE | 62 | 51 | 53.05 | 50.25 | 50.77 | 53.11 | C | C |
| GENOA CENTRAL | 67 | 56 | 54.40 | 51.51 | 56.18 | 57.17 | B | B |
| GENTRY | 66 | 48 | 54.12 | 49.50 | 55.07 | 50.68 | B | C |
| GLEN ROSE | 61 | 51 | 52.79 | 50.25 | 49.72 | 53.11 | C | C |
| GOSNELL | 62 | 46 | 53.05 | 49.00 | 50.77 | 49.06 | C | C |
| GRAVETTE | 68 | 58 | 54.68 | 52.02 | 57.29 | 58.81 | B | B |
| GREEN FOREST | 59 | 40 | 52.28 | 47.47 | 47.64 | 44.13 | C | C |
| GREENBRIER | 74 | 61 | 56.43 | 52.79 | 64.35 | 61.31 | A | B |
| GREENE COUNTYTECH | 71 | 58 | 55.53 | 52.02 | 60.74 | 58.81 | B | B |
| GREENLAND | 62 | 61 | 53.05 | 52.79 | 50.77 | 61.31 | C | B |
| GREENWOOD | 77 | 67 | 57.39 | 54.40 | 68.19 | 66.49 | A | A |
| GURDON | 67 | 38 | 54.40 | 46.95 | 56.18 | 42.45 | B | C |
| GUY-PERKINS | 65 | 43 | 53.85 | 48.24 | 53.98 | 46.61 | B | C |
| HAAS HALL ACADEMY | 80 | 82 | 58.42 | 59.15 | 72.32 | 81.82 | A | A |
| HACKETT | 60 | 42 | 52.53 | 47.98 | 48.68 | 45.79 | C | C |
| HAMBURG | 61 | 39 | 52.79 | 47.21 | 49.72 | 43.29 | C | C |
| HAMPTON | 57 | 44 | 51.76 | 48.49 | 45.59 | 47.43 | C | C |
| HARMONY GROVE (Ouachita Co.) | 67 | 53 | 54.40 | 50.75 | 56.18 | 54.73 | B | B |
| HARMONY GROVE (Saline Co.) | 65 | 50 | 53.85 | 50.00 | 53.98 | 52.30 | B | C |
| HARRISBURG | 55 | 36 | 51.26 | 46.42 | 43.55 | 40.74 | C | D |
| HARRISON | 69 | 66 | 54.96 | 54.12 | 58.42 | 65.60 | B | A |
| HARTFORD | 54 | 34 | 51.00 | 45.88 | 42.53 | 39.00 | C | D |
| HAZEN | 56 | 44 | 51.51 | 48.49 | 44.57 | 47.43 | C | C |
| HEBER | 71 | 57 | 55.53 | 51.76 | 60.74 | 57.99 | B | B |
| HECTOR | 59 | 52 | 52.28 | 50.50 | 47.64 | 53.92 | C | B |
| HELENA/W. HELENA | 44 | 22 | 48.49 | 42.28 | 32.43 | 27.39 | F | F |
| HERMITAGE | 38 | 14 | 46.95 | 39.20 | 26.22 | 17.46 | F | F |
| HIGHLAND | 63 | 47 | 53.32 | 49.25 | 51.83 | 49.87 | C | C |
| HILLCREST | 59 | 48 | 52.28 | 49.50 | 47.64 | 50.68 | C | C |
| HOPE | 49 | 34 | 49.75 | 45.88 | 37.49 | 39.00 | D | D |
| HORATIO | 57 | 44 | 51.76 | 48.49 | 45.59 | 47.43 | C | C |
| HOT SPRINGS | 60 | 37 | 52.53 | 46.68 | 48.68 | 41.60 | C | C |
| HOXIE | 63 | 52 | 53.32 | 50.50 | 51.83 | 53.92 | C | B |
| HUGHES | 32 | 22 | 45.32 | 42.28 | 19.70 | 27.39 | F | F |
| HUNTSVILLE | 72 | 52 | 55.83 | 50.50 | 61.92 | 53.92 | B | B |
| IZARD COUNTY CONS. | 66 | 57 | 54.12 | 51.76 | 55.07 | 57.99 | B | B |
| JACKSON COUNTY | 64 | 45 | 53.58 | 48.74 | 52.90 | 48.25 | C | C |
| JASPER | 63 | 55 | 53.32 | 51.26 | 51.83 | 56.35 | C | B |
| JESSIEVILLE | 72 | 56 | 55.83 | 51.51 | 61.92 | 57.17 | B | B |
| JONESBORO | 65 | 50 | 53.85 | 50.00 | 53.98 | 52.30 | B | C |
| JUNCTION CITY | 54 | 45 | 51.00 | 48.74 | 42.53 | 48.25 | C | C |
| KIPP DELTA COLLEGE PREP | 76 | 59 | 57.06 | 52.28 | 66.88 | 59.64 | A | B |
| KIRBY | 56 | 52 | 51.51 | 50.50 | 44.57 | 53.92 | C | B |
| LAFAYETTE COUNTY | 47 | 22 | 49.25 | 42.28 | 35.47 | 27.39 | D | F |
| LAKE HAMILTON | 78 | 70 | 57.72 | 55.24 | 69.53 | 69.21 | A | A |
| LAKESIDE (Chicot Co.) | 50 | 22 | 50.00 | 42.28 | 38.50 | 27.39 | D | F |
| LAKESIDE (Garland Co.) | 74 | 67 | 56.43 | 54.40 | 64.35 | 66.49 | A | A |
| LAMAR | 63 | 50 | 53.32 | 50.00 | 51.83 | 52.30 | C | C |
| LAVACA | 50 | 49 | 50.00 | 49.75 | 38.50 | 51.49 | D | C |
| LAWRENCE COUNTY | 55 | 48 | 51.26 | 49.50 | 43.55 | 50.68 | C | C |
| LEAD HILL | 56 | 56 | 51.51 | 51.51 | 44.57 | 57.17 | C | B |
| LEE COUNTY | 47 | 24 | 49.25 | 42.94 | 35.47 | 29.52 | D | F |
| LINCOLN | 65 | 50 | 53.85 | 50.00 | 53.98 | 52.30 | B | C |
| LISA ACADEMY | 83 | 74 | 59.54 | 56.43 | 76.84 | 73.05 | A | A |
| LITTLE ROCK | 51 | 39 | 50.25 | 47.21 | 39.51 | 43.29 | D | C |
| LONOKE | 58 | 49 | 52.02 | 49.75 | 46.61 | 51.49 | C | C |
| MAGAZINE | 63 | 51 | 53.32 | 50.25 | 51.83 | 53.11 | C | C |
| MAGNET COVE | 69 | 51 | 54.96 | 50.25 | 58.42 | 53.11 | B | C |
| MAGNOLIA | 59 | 36 | 52.28 | 46.42 | 47.64 | 40.74 | C | D |
| MALVERN | 59 | 46 | 52.28 | 49.00 | 47.64 | 49.06 | C | C |
| MAMMOTH SPRING | 54 | 55 | 51.00 | 51.26 | 42.53 | 56.35 | C | B |
| MANILA | 66 | 42 | 54.12 | 47.98 | 55.07 | 45.79 | B | C |
| MANSFIELD | 62 | 48 | 53.05 | 49.50 | 50.77 | 50.68 | C | C |
| MARION | 69 | 51 | 54.96 | 50.25 | 58.42 | 53.11 | B | C |
| MARKED TREE | 63 | 45 | 53.32 | 48.74 | 51.83 | 48.25 | C | C |
| MARMADUKE | 44 | 35 | 48.49 | 46.15 | 32.43 | 39.87 | F | D |
| MARVELL | 48 | 24 | 49.50 | 42.94 | 36.48 | 29.52 | D | F |
| MAYFLOWER | 65 | 52 | 53.85 | 50.50 | 53.98 | 53.92 | B | B |
| MAYNARD | 56 | 41 | 51.51 | 47.72 | 44.57 | 44.96 | C | C |
| MCCRORY | 72 | 55 | 55.83 | 51.26 | 61.92 | 56.35 | B | B |
| MCGEHEE | 57 | 43 | 51.76 | 48.24 | 45.59 | 46.61 | C | C |
| MELBOURNE | 57 | 54 | 51.76 | 51.00 | 45.59 | 55.54 | C | B |
| MENA | 74 | 66 | 56.43 | 54.12 | 64.35 | 65.60 | A | A |
| MIDLAND | 62 | 46 | 53.05 | 49.00 | 50.77 | 49.06 | C | C |
| MINERAL SPRINGS | 45 | 31 | 48.74 | 45.04 | 33.45 | 36.31 | F | D |
| MONTICELLO | 63 | 47 | 53.32 | 49.25 | 51.83 | 49.87 | C | C |
| MOUNT IDA | 67 | 50 | 54.40 | 50.00 | 56.18 | 52.30 | B | C |
| MOUNTAIN HOME | 70 | 60 | 55.24 | 52.53 | 59.57 | 60.47 | B | B |
| MOUNTAIN PINE | 67 | 53 | 54.40 | 50.75 | 56.18 | 54.73 | B | B |
| MOUNTAIN VIEW | 72 | 61 | 55.83 | 52.79 | 61.92 | 61.31 | B | B |
| MOUNTAINBURG | 74 | 57 | 56.43 | 51.76 | 64.35 | 57.99 | A | B |
| MT. VERNON/ENOLA | 69 | 50 | 54.96 | 50.00 | 58.42 | 52.30 | B | C |
| MULBERRY | 61 | 38 | 52.79 | 46.95 | 49.72 | 42.45 | C | C |
| MURFREESBORO | 63 | 54 | 53.32 | 51.00 | 51.83 | 55.54 | C | B |
| NASHVILLE | 59 | 44 | 52.28 | 48.49 | 47.64 | 47.43 | C | C |
| NEMO VISTA | 66 | 58 | 54.12 | 52.02 | 55.07 | 58.81 | B | B |
| NETTLETON | 65 | 57 | 53.85 | 51.76 | 53.98 | 57.99 | B | B |
| NEVADA COUNTY | 48 | 30 | 49.50 | 44.76 | 36.48 | 35.39 | D | D |
| NEWPORT | 56 | 42 | 51.51 | 47.98 | 44.57 | 45.79 | C | C |
| NORFORK | 67 | 66 | 54.40 | 54.12 | 56.18 | 65.60 | B | A |
| NORPHLET | 58 | 41 | 52.02 | 47.72 | 46.61 | 44.96 | C | C |
| NORTH LITTLE ROCK | 54 | 38 | 51.00 | 46.95 | 42.53 | 42.45 | C | C |
| NWA ACADEMY FINE ART | 70 | 75 | 55.24 | 56.74 | 59.57 | 74.06 | B | A |
| OMAHA | 56 | 57 | 51.51 | 51.76 | 44.57 | 57.99 | C | B |
| OSCEOLA | 44 | 29 | 48.49 | 44.47 | 32.43 | 34.45 | F | D |
| OUACHITA | 67 | 45 | 54.40 | 48.74 | 56.18 | 48.25 | B | C |
| OUACHITA RIVER | 58 | 49 | 52.02 | 49.75 | 46.61 | 51.49 | C | C |
| OZARK | 62 | 54 | 53.05 | 51.00 | 50.77 | 55.54 | C | B |
| OZARK MOUNTAIN | 58 | 42 | 52.02 | 47.98 | 46.61 | 45.79 | C | C |
| PALESTINE/WHEATLEY | 44 | 27 | 48.49 | 43.87 | 32.43 | 32.53 | F | F |
| PANGBURN | 58 | 49 | 52.02 | 49.75 | 46.61 | 51.49 | C | C |
| PARAGOULD | 59 | 42 | 52.28 | 47.98 | 47.64 | 45.79 | C | C |
| PARIS | 71 | 58 | 55.53 | 52.02 | 60.74 | 58.81 | B | B |
| PARKERS CHAPEL | 74 | 63 | 56.43 | 53.32 | 64.35 | 63.00 | A | A |
| PEA RIDGE | 66 | 59 | 54.12 | 52.28 | 55.07 | 59.64 | B | B |
| PERRYVILLE | 71 | 57 | 55.53 | 51.76 | 60.74 | 57.99 | B | B |
| PIGGOTT | 57 | 51 | 51.76 | 50.25 | 45.59 | 53.11 | C | C |
| PINE BLUFF | 43 | 29 | 48.24 | 44.47 | 31.41 | 34.45 | F | D |
| POCAHONTAS | 61 | 47 | 52.79 | 49.25 | 49.72 | 49.87 | C | C |
| POTTSVILLE | 74 | 74 | 56.43 | 56.43 | 64.35 | 73.05 | A | A |
| POYEN | 66 | 44 | 54.12 | 48.49 | 55.07 | 47.43 | B | C |
| PRAIRIE GROVE | 57 | 43 | 51.76 | 48.24 | 45.59 | 46.61 | C | C |
| PRESCOTT | 58 | 37 | 52.02 | 46.68 | 46.61 | 41.60 | C | C |
| PULASKI COUNTY | 50 | 39 | 50.00 | 47.21 | 38.50 | 43.29 | D | C |
| QUITMAN | 55 | 41 | 51.26 | 47.72 | 43.55 | 44.96 | C | C |
| RECTOR | 64 | 52 | 53.58 | 50.50 | 52.90 | 53.92 | C | B |
| RIVERSIDE | 48 | 50 | 49.50 | 50.00 | 36.48 | 52.30 | D | C |
| RIVERVIEW | 58 | 48 | 52.02 | 49.50 | 46.61 | 50.68 | C | C |
| ROGERS | 70 | 60 | 55.24 | 52.53 | 59.57 | 60.47 | B | B |
| ROSE BUD | 54 | 45 | 51.00 | 48.74 | 42.53 | 48.25 | C | C |
| RUSSELLVILLE | 65 | 53 | 53.85 | 50.75 | 53.98 | 54.73 | B | B |
| SALEM | 76 | 68 | 57.06 | 54.68 | 66.88 | 67.39 | A | A |
| SCRANTON | 82 | 67 | 59.15 | 54.40 | 75.28 | 66.49 | A | A |
| SEARCY | 74 | 63 | 56.43 | 53.32 | 64.35 | 63.00 | A | A |
| SEARCY COUNTY | 59 | 41 | 52.28 | 47.72 | 47.64 | 44.96 | C | C |
| SHERIDAN | 74 | 53 | 56.43 | 50.75 | 64.35 | 54.73 | A | B |
| SHIRLEY | 58 | 43 | 52.02 | 48.24 | 46.61 | 46.61 | C | C |
| SILOAM SPRINGS | 71 | 55 | 55.53 | 51.26 | 60.74 | 56.35 | B | B |
| SLOAN-HENDRIX | 50 | 37 | 50.00 | 46.68 | 38.50 | 41.60 | D | C |
| SMACKOVER | 53 | 45 | 50.75 | 48.74 | 41.52 | 48.25 | D | C |
| SOUTH CONWAY COUNTY | 62 | 46 | 53.05 | 49.00 | 50.77 | 49.06 | C | C |
| SOUTH MISSISSIPPI COUNTY | 58 | 32 | 52.02 | 45.32 | 46.61 | 37.22 | C | D |
| SOUTH SIDE (Van Buren Co.) | 66 | 48 | 54.12 | 49.50 | 55.07 | 50.68 | B | C |
| SOUTHSIDE (Independence Co.) | 62 | 54 | 53.05 | 51.00 | 50.77 | 55.54 | C | B |
| SPRING HILL | 66 | 36 | 54.12 | 46.42 | 55.07 | 40.74 | B | D |
| SPRINGDALE | 68 | 55 | 54.68 | 51.26 | 57.29 | 56.35 | B | B |
| STAR CITY | 70 | 51 | 55.24 | 50.25 | 59.57 | 53.11 | B | C |
| STEPHENS | 45 | 23 | 48.74 | 42.61 | 33.45 | 28.47 | F | F |
| STRONG-HUTTIG | 41 | 29 | 47.72 | 44.47 | 29.36 | 34.45 | F | D |
| STUTTGART | 59 | 41 | 52.28 | 47.72 | 47.64 | 44.96 | C | C |
| TEXARKANA | 52 | 31 | 50.50 | 45.04 | 40.51 | 36.31 | D | D |
| TRUMANN | 57 | 36 | 51.76 | 46.42 | 45.59 | 40.74 | C | D |
| TURRELL | 39 | 23 | 47.21 | 42.61 | 27.27 | 28.47 | F | F |
| TWIN RIVERS | 58 | 41 | 52.02 | 47.72 | 46.61 | 44.96 | C | C |
| TWO RIVERS | 57 | 46 | 51.76 | 49.00 | 45.59 | 49.06 | C | C |
| VALLEY SPRINGS | 70 | 61 | 55.24 | 52.79 | 59.57 | 61.31 | B | B |
| VALLEY VIEW | 77 | 68 | 57.39 | 54.68 | 68.19 | 67.39 | A | A |
| VAN BUREN | 67 | 54 | 54.40 | 51.00 | 56.18 | 55.54 | B | B |
| VAN COVE | 53 | 38 | 50.75 | 46.95 | 41.52 | 42.45 | D | C |
| VILONIA | 68 | 65 | 54.68 | 53.85 | 57.29 | 64.73 | B | A |
| VIOLA | 71 | 44 | 55.53 | 48.49 | 60.74 | 47.43 | B | C |
| WALDRON | 58 | 45 | 52.02 | 48.74 | 46.61 | 48.25 | C | C |
| WARREN | 61 | 36 | 52.79 | 46.42 | 49.72 | 40.74 | C | D |
| WATSON CHAPEL | 52 | 42 | 50.50 | 47.98 | 40.51 | 45.79 | D | C |
| WEINER | 60 | 49 | 52.53 | 49.75 | 48.68 | 51.49 | C | C |
| WEST FORK | 59 | 47 | 52.28 | 49.25 | 47.64 | 49.87 | C | C |
| WEST MEMPHIS | 48 | 28 | 49.50 | 44.17 | 36.48 | 33.50 | D | F |
| WEST SIDE (Cleburne Co.) | 61 | 50 | 52.79 | 50.00 | 49.72 | 52.30 | C | C |
| WESTERN YELL COUNTY | 58 | 42 | 52.02 | 47.98 | 46.61 | 45.79 | C | C |
| WESTSIDE (Johnson Co.) | 61 | 49 | 52.79 | 49.75 | 49.72 | 51.49 | C | C |
| WESTSIDE CONS. (Craighead Co.) | 66 | 55 | 54.12 | 51.26 | 55.07 | 56.35 | B | B |
| WHITE COUNTY CENTRAL | 58 | 46 | 52.02 | 49.00 | 46.61 | 49.06 | C | C |
| WHITE HALL | 68 | 59 | 54.68 | 52.28 | 57.29 | 59.64 | B | B |
| WICKES | 61 | 44 | 52.79 | 48.49 | 49.72 | 47.43 | C | C |
| WONDERVIEW | 71 | 62 | 55.53 | 53.05 | 60.74 | 62.15 | B | B |
| WOODLAWN | 65 | 53 | 53.85 | 50.75 | 53.98 | 54.73 | B | B |
| WYNNE | 66 | 48 | 54.12 | 49.50 | 55.07 | 50.68 | B | C |
| YELLVILLE-SUMMIT | 63 | 53 | 53.32 | 50.75 | 51.83 | 54.73 | C | B |
| n = | 250 | 250 | 250 | 250 | ||||
| Mean = | 52.86 | 49.29 | 50.00 | 50.00 | ||||
| Standard Deviation = | 2.49 | 3.10 | 10.00 | 10.00 | ||||
Adjustment Letter Grade s
| District | nk em ile nk | ng nal | T | T | T | T | T | T | + T | ent | T | de |
| ACADEMICS PLUS | 94.65 | n/a | ||||||||||
| ALMA | 63 | 50 | 53.32 | 50.00 | 60.42 | 55.77 | 116.19 | 106.08 | 106.67 | -0.59 | 49.64 | C |
| ALPENA | 42 | 35 | 47.98 | 46.15 | 44.96 | 44.84 | 89.81 | 114.21 | 94.78 | 19.43 | 61.75 | B |
| ARKADELPHIA | 64 | 55 | 53.58 | 51.26 | 61.19 | 59.34 | 120.52 | 121.56 | 108.62 | 12.94 | 57.82 | B |
| ARMOREL | 41 | 31 | 47.72 | 45.04 | 44.22 | 41.71 | 85.93 | 122.05 | 93.04 | 29.01 | 67.54 | A |
| ASHDOWN | 52 | 50 | 50.50 | 50.00 | 52.26 | 55.77 | 108.03 | 97.97 | 103.00 | -5.03 | 46.96 | C |
| ATKINS | 57 | 57 | 51.76 | 51.76 | 55.91 | 60.78 | 116.69 | 101.96 | 106.90 | -4.93 | 47.02 | C |
| AUGUSTA | 37 | 33 | 46.68 | 45.60 | 41.20 | 43.29 | 84.50 | 57.77 | 92.39 | -34.62 | 29.07 | F |
| BALD KNOB | 61 | 58 | 52.79 | 52.02 | 58.90 | 61.50 | 120.39 | 89.90 | 108.56 | -18.66 | 38.72 | D |
| BARTON-LEXA | 50 | 46 | 50.00 | 49.00 | 50.81 | 52.92 | 103.73 | 93.42 | 101.06 | -7.64 | 45.38 | C |
| BATESVILLE | 43 | 33 | 48.24 | 45.60 | 45.70 | 43.29 | 89.00 | 118.33 | 94.42 | 23.91 | 64.46 | A |
| BAUXITE | 53 | 42 | 50.75 | 47.98 | 52.99 | 50.05 | 103.03 | 100.98 | 100.74 | 0.24 | 50.14 | C |
| BAY | 41 | 51 | 47.72 | 50.25 | 44.22 | 56.48 | 100.70 | 106.31 | 99.69 | 6.62 | 54.00 | B |
| BEARDEN | 30 | 20 | 44.76 | 41.58 | 35.63 | 31.90 | 67.53 | 79.94 | 84.75 | -4.81 | 47.09 | C |
| BEEBE | 53 | 45 | 50.75 | 48.74 | 52.99 | 52.21 | 105.20 | 115.11 | 101.72 | 13.39 | 58.10 | B |
| BENTON | 66 | 48 | 54.12 | 49.50 | 62.75 | 54.35 | 117.10 | 127.35 | 107.08 | 20.27 | 62.26 | B |
| BENTONVILLE | 69 | 59 | 54.96 | 52.28 | 65.16 | 62.23 | 127.39 | 138.74 | 111.72 | 27.03 | 66.34 | A |
| BERGMAN | 61 | 55 | 52.79 | 51.26 | 58.90 | 59.34 | 118.23 | 118.66 | 107.59 | 11.07 | 56.70 | B |
| BERRYVILLE | 54 | 44 | 51.00 | 48.49 | 53.72 | 51.49 | 105.21 | 107.09 | 101.72 | 5.37 | 53.25 | C |
| BISMARCK | 46 | 42 | 49.00 | 47.98 | 47.90 | 50.05 | 97.95 | 123.15 | 98.45 | 24.70 | 64.94 | A |
| BLEVINS | 35 | 30 | 46.15 | 44.76 | 39.65 | 40.90 | 80.55 | 81.10 | 90.62 | -9.51 | 44.25 | C |
| BLYTHEVILLE | 40 | 28 | 47.47 | 44.17 | 43.47 | 39.24 | 82.71 | 66.01 | 91.59 | -25.58 | 34.53 | D |
| BOONEVILLE | 54 | 54 | 51.00 | 51.00 | 53.72 | 58.62 | 112.34 | 116.93 | 104.93 | 12.00 | 57.25 | B |
| BRADFORD | 50 | 55 | 50.00 | 51.26 | 50.81 | 59.34 | 110.15 | 99.51 | 103.95 | -4.43 | 47.32 | C |
| BRADLEY | 60 | 73 | 52.53 | 56.13 | 58.14 | 73.16 | 131.30 | 105.36 | 113.48 | -8.12 | 45.09 | C |
| BRINKLEY | 39 | 39 | 47.21 | 47.21 | 42.72 | 47.85 | 90.57 | 77.05 | 95.13 | -18.08 | 39.07 | D |
| BROOKLAND | 63 | 57 | 53.32 | 51.76 | 60.42 | 60.78 | 121.19 | 87.31 | 108.92 | -21.61 | 36.93 | D |
| BRYANT | 59 | 54 | 52.28 | 51.00 | 57.40 | 58.62 | 116.02 | 129.08 | 106.59 | 22.49 | 63.60 | A |
| BUFFALO ISLAND | 53 | 39 | 50.75 | 47.21 | 52.99 | 47.85 | 100.84 | 110.40 | 99.75 | 10.65 | 56.44 | B |
| CENTR CABOT |
56 |
39 |
51.51 |
47.21 |
55.18 |
47.85 |
103.03 |
116.41 |
100.74 |
15.67 |
59.48 |
B |
| CADDO HILLS | 53 | 52 | 50.75 | 50.50 | 52.99 | 57.20 | 110.18 | 117.56 | 103.96 | 13.60 | 58.22 | B |
| CALICO ROCK | 40 | 38 | 47.47 | 46.95 | 43.47 | 47.11 | 90.58 | 104.00 | 95.13 | 8.86 | 55.36 | B |
| CAMDEN-FAIRVIEW | 44 | 31 | 48.49 | 45.04 | 46.44 | 41.71 | 88.15 | 96.33 | 94.04 | 2.30 | 51.39 | C |
| CARLISLE | 52 | 39 | 50.50 | 47.21 | 52.26 | 47.85 | 100.11 | 87.86 | 99.43 | -11.57 | 43.00 | C |
| CAVE CITY | 57 | 55 | 51.76 | 51.26 | 55.91 | 59.34 | 115.25 | 97.52 | 106.25 | -8.73 | 44.72 | C |
| CEDAR RIDGE | 41 | 39 | 47.72 | 47.21 | 44.22 | 47.85 | 92.07 | 88.14 | 95.80 | -7.67 | 45.36 | C |
| CEDARVILLE | 55 | 35 | 51.26 | 46.15 | 54.45 | 44.84 | 99.29 | 103.07 | 99.06 | 4.02 | 52.43 | C |
| CENTERPOINT | 55 | 39 | 51.26 | 47.21 | 54.45 | 47.85 | 102.30 | 100.65 | 100.41 | 0.24 | 50.14 | C |
| CHARLESTON | 42 | 43 | 47.98 | 48.24 | 44.96 | 50.77 | 95.73 | 107.49 | 97.45 | 10.03 | 56.07 | B |
| CLARENDON | 57 | 40 | 51.76 | 47.47 | 55.91 | 48.59 | 104.50 | 67.47 | 101.40 | -33.94 | 29.48 | F |
| CLARKSVILLE | 64 | 61 | 53.58 | 52.79 | 61.19 | 63.70 | 124.88 | 116.65 | 110.59 | 6.06 | 53.67 | C |
| CLEVELAND COUNTY | 54 | 54 | 51.00 | 51.00 | 53.72 | 58.62 | 112.34 | 105.76 | 104.93 | 0.82 | 50.50 | C |
| CLINTON | 45 | 32 | 48.74 | 45.32 | 47.17 | 42.51 | 89.68 | 101.34 | 94.73 | 6.61 | 54.00 | B |
| CONCORD | 56 | 45 | 51.51 | 48.74 | 55.18 | 52.21 | 107.39 | 105.26 | 102.70 | 2.56 | 51.55 | C |
| CONWAY | 59 | 49 | 52.28 | 49.75 | 57.40 | 55.06 | 112.46 | 131.74 | 104.99 | 26.75 | 66.17 | A |
| CORNING | 56 | 49 | 51.51 | 49.75 | 55.18 | 55.06 | 110.24 | 79.63 | 103.99 | -24.36 | 35.27 | D |
| COTTER | 69 | 74 | 54.96 | 56.43 | 65.16 | 74.02 | 139.19 | 105.47 | 117.03 | -11.56 | 43.01 | C |
| COUNTY LINE | 63 | 57 | 53.32 | 51.76 | 60.42 | 60.78 | 121.19 | 108.44 | 108.92 | -0.48 | 49.71 | C |
| CROSS COUNTY | 54 | 29 | 51.00 | 44.47 | 53.72 | 40.08 | 93.79 | 85.48 | 96.58 | -11.10 | 43.29 | C |
| CROSSETT | 54 | 43 | 51.00 | 48.24 | 53.72 | 50.77 | 104.49 | 78.23 | 101.40 | -23.17 | 35.99 | D |
| CUSHMAN | 19 | 16 | 41.22 | 40.06 | 25.39 | 27.56 | 52.96 | 88.88 | 78.18 | 10.69 | 56.47 | B |
| CUTTER-MRG.STAR | 60 | 46 | 52.53 | 49.00 | 58.14 | 52.92 | 111.07 | 95.25 | 104.36 | -9.11 | 44.49 | C |
| DANVILLE | 37 | 35 | 46.68 | 46.15 | 41.20 | 44.84 | 86.04 | 102.02 | 93.09 | 8.93 | 55.40 | B |
| DARDANELLE | 42 | 38 | 47.98 | 46.95 | 44.96 | 47.11 | 92.07 | 124.43 | 95.80 | 28.63 | 67.31 | A |
| DECATUR | 16 | 11 | 40.06 | 37.73 | 22.02 | 20.98 | 43.00 | 95.25 | 73.70 | 21.55 | 63.03 | A |
| DEER/MT. JUDEA | 51 | 32 | 50.25 | 45.32 | 51.53 | 42.51 | 94.04 | 105.54 | 96.69 | 8.85 | 55.35 | B |
| DELIGHT | 57 | 71 | 51.76 | 55.53 | 55.91 | 71.47 | 127.38 | 60.92 | 111.71 | -50.79 | 19.29 | F |
| DEQUEEN | 43 | 44 | 48.24 | 48.49 | 45.70 | 51.49 | 97.19 | 86.48 | 98.11 | -11.63 | 42.97 | C |
| DERMOTT | 21 | 30 | 41.94 | 44.76 | 27.46 | 40.90 | 68.36 | 55.65 | 85.12 | -29.48 | 32.18 | F |
| DES ARC | 44 | 33 | 48.49 | 45.60 | 46.44 | 43.29 | 89.73 | 98.69 | 94.75 | 3.94 | 52.38 | C |
| DEWITT | 50 | 55 | 50.00 | 51.26 | 50.81 | 59.34 | 110.15 | 96.56 | 103.95 | -7.38 | 45.53 | C |
| DIERKS | 42 | 41 | 47.98 | 47.72 | 44.96 | 49.32 | 94.28 | 90.16 | 96.80 | -6.64 | 45.98 | C |
| DOLLARWAY | 39 | 31 | 47.21 | 45.04 | 42.72 | 41.71 | 84.43 | 49.15 | 92.36 | -43.21 | 23.87 | F |
| DOVER | 58 | 48 | 52.02 | 49.50 | 56.65 | 54.35 | 111.00 | 109.00 | 104.33 | 4.67 | 52.82 | C |
| DREW CENTRAL | 46 | 35 | 49.00 | 46.15 | 47.90 | 44.84 | 92.74 84.81 96.11 | -11.29 | 43.17 | C | ||
| DUMAS | 27 | 29 | 43.87 | 44.47 | 33.07 | 40.08 | 73.14 | 78.50 | 87.28 | -8.77 | 44.69 | C |
| EARLE | 38 | 36 | 46.95 | 46.42 | 41.96 | 45.61 | 87.57 | 52.51 | 93.78 | -41.26 | 25.05 | F |
| EAST END | 35 | 27 | 46.15 | 43.87 | 39.65 | 38.39 | 78.04 | 108.44 | 89.49 | 18.96 | 61.46 | B |
| EAST POINSETT COUNTY | 39 | 23 | 47.21 | 42.61 | 42.72 | 34.82 | 77.54 | 90.93 | 89.26 | 1.68 | 51.01 | C |
| EL DORADO | 41 | 34 | 47.72 | 45.88 | 44.22 | 44.07 | 88.29 | 86.00 | 94.10 | -8.11 | 45.10 | C |
| ELKINS | 53 | 39 | 50.75 | 47.21 | 52.99 | 47.85 | 100.84 | 112.60 | 99.75 | 12.84 | 57.77 | B |
| EMERSON-TAYLOR | 47 | 49 | 49.25 | 49.75 | 48.63 | 55.06 | 103.69 | 114.65 | 101.04 | 13.61 | 58.23 | B |
| ENGLAND | 54 | 29 | 51.00 | 44.47 | 53.72 | 40.08 | 93.79 | 79.63 | 96.58 | -16.95 | 39.75 | D |
| EUREKA | 45 | 30 | 48.74 | 44.76 | 47.17 | 40.90 | 88.07 | 105.26 | 94.00 | 11.26 | 56.81 | B |
| FARMINGTON | 54 | 45 | 51.00 | 48.74 | 53.72 | 52.21 | 105.92 | 120.04 | 102.05 | 18.00 | 60.88 | B |
| FAYETTEVILLE | 58 | 47 | 52.02 | 49.25 | 56.65 | 53.64 | 110.29 | 133.37 | 104.01 | 29.36 | 67.75 | A |
| FLIPPIN | 43 | 40 | 48.24 | 47.47 | 45.70 | 48.59 | 94.29 | 87.98 | 96.80 | -8.83 | 44.66 | C |
| FORDYCE | 29 | 31 | 44.47 | 45.04 | 34.79 | 41.71 | 76.50 | 79.09 | 88.79 | -9.70 | 44.13 | C |
| FOREMAN | 38 | 41 | 46.95 | 47.72 | 41.96 | 49.32 | 91.28 | 108.78 | 95.45 | 13.33 | 58.06 | B |
| FORREST CITY | 30 | 16 | 44.76 | 40.06 | 35.63 | 27.56 | 63.19 | 55.40 | 82.79 | -27.40 | 33.43 | F |
| FORT SMITH | 38 | 30 | 46.95 | 44.76 | 41.96 | 40.90 | 82.86 | 103.86 | 91.66 | 12.20 | 57.38 | B |
| FOUKE | 44 | 36 | 48.49 | 46.42 | 46.44 | 45.61 | 92.04 | 95.89 | 95.79 | 0.10 | 50.06 | C |
| FOUNTAIN LAKE | 55 | 43 | 51.26 | 48.24 | 54.45 | 50.77 | 105.22 | 103.88 | 101.73 | 2.16 | 51.30 | C |
| GENOA CENTRAL | 57 | 61 | 51.76 | 52.79 | 55.91 | 63.70 | 119.61 | 113.35 | 108.21 | 5.13 | 53.10 | C |
| GENTRY | 41 | 38 | 47.72 | 46.95 | 44.22 | 47.11 | 91.33 | 105.76 | 95.47 | 10.29 | 56.22 | B |
| GLEN ROSE | 49 | 45 | 49.75 | 48.74 | 50.08 | 52.21 | 102.29 | 102.83 | 100.41 | 2.42 | 51.47 | C |
| GOSNELL | 44 | 37 | 48.49 | 46.68 | 46.44 | 46.36 | 92.80 | 99.84 | 96.13 | 3.70 | 52.24 | C |
| GRAVETTE | 34 | 33 | 45.88 | 45.60 | 38.87 | 43.29 | 82.16 | 116.11 | 91.34 | 24.76 | 64.97 | A |
| GREEN FOREST | 46 | 41 | 49.00 | 47.72 | 47.90 | 49.32 | 97.22 | 91.77 | 98.12 | -6.35 | 46.16 | C |
| GREENBRIER | 64 | 44 | 53.58 | 48.49 | 61.19 | 51.49 | 112.68 | 125.66 | 105.09 | 20.57 | 62.44 | B |
| GREENE COUNTYTECH | 71 | 50 | 55.53 | 50.00 | 66.83 | 55.77 | 122.60 | 119.55 | 109.56 | 9.99 | 56.04 | B |
| GREENLAND | 39 | 34 | 47.21 | 45.88 | 42.72 | 44.07 | 86.80 | 112.08 | 93.43 | 18.66 | 61.28 | B |
| GREENWOOD | 76 | 68 | 57.06 | 54.68 | 71.26 | 69.04 | 140.30 | 134.68 | 117.53 | 17.15 | 60.37 | B |
| GURDON | 33 | 37 | 45.60 | 46.68 | 38.07 | 46.36 | 84.43 | 98.62 | 92.36 | 6.26 | 53.79 | C |
| GUY-PERKINS | 63 | 41 | 53.32 | 47.72 | 60.42 | 49.32 | 109.73 | 100.59 | 103.76 | -3.17 | 48.08 | C |
| HAAS HALL ACADEMY | 154.14 | n/a | ||||||||||
| HACKETT | 45 | 45 | 48.74 | 48.74 | 47.17 | 52.21 | 99.38 | 94.47 | 99.10 | -4.63 | 47.20 | C |
| HAMBURG | 51 | 49 | 50.25 | 49.75 | 51.53 | 55.06 | 106.60 | 93.01 | 102.35 | -9.33 | 44.36 | C |
| HAMPTON | 41 | 34 | 47.72 | 45.88 | 44.22 | 44.07 | 88.29 | 93.02 | 94.10 | -1.09 | 49.34 | C |
| HARMONY GROVE | 42 | 43 | 47.98 | 48.24 | 44.96 | 50.77 | 95.73 | 110.90 | 97.45 | 13.45 | 58.13 | B |
| (Ouachita Co.) HARMONY GROVE |
40 |
23 |
47.47 |
42.61 |
43.47 |
34.82 |
78.29 |
106.28 |
89.60 |
16.69 |
60.09 |
B |
| (Saline Co.) HARRISBURG |
68 |
55 |
54.68 |
51.26 |
64.35 |
59.34 |
123.69 |
84.29 |
110.05 |
-25.76 |
34.42 |
D |
| HARRISON | 59 | 60 | 52.28 | 52.53 | 57.40 | 62.96 | 120.36 | 124.03 | 108.55 | 15.48 | 59.36 | B |
| HARTFORD | 59 | 50 | 52.28 | 50.00 | 57.40 | 55.77 | 113.17 | 81.53 | 105.31 | -23.78 | 35.62 | D |
| HAZEN | 55 | 56 | 51.26 | 51.51 | 54.45 | 60.05 | 114.50 | 92.00 | 105.91 | -13.91 | 41.59 | C |
| HEBER | 57 | 48 | 51.76 | 49.50 | 55.91 | 54.35 | 110.26 | 118.73 | 104.00 | 14.72 | 58.90 | B |
| HECTOR | 69 | 64 | 54.96 | 53.58 | 65.16 | 65.94 | 131.10 | 101.56 | 113.39 | -11.83 | 42.85 | C |
| HELENA/W. HELENA | 52 | 50 | 50.50 | 50.00 | 52.26 | 55.77 | 108.03 | 59.83 | 103.00 | -43.17 | 23.90 | F |
| HERMITAGE | 53 | 52 | 50.75 | 50.50 | 52.99 | 57.20 | 110.18 | 43.68 | 103.96 | -60.28 | 13.55 | F |
| HIGHLAND | 37 | 34 | 46.68 | 45.88 | 41.20 | 44.07 | 85.27 | 101.71 | 92.74 | 8.96 | 55.42 | B |
| HILLCREST | 64 | 70 | 53.58 | 55.24 | 61.19 | 70.65 | 131.83 | 98.33 | 113.72 | -15.39 | 40.69 | D |
| HOPE | 44 | 36 | 48.49 | 46.42 | 46.44 | 45.61 | 92.04 | 76.49 | 95.79 | -19.30 | 38.33 | D |
| HORATIO | 53 | 53 | 50.75 | 50.75 | 52.99 | 57.91 | 110.90 | 93.02 | 104.29 | -11.27 | 43.19 | C |
| HOT SPRINGS | 52 | 45 | 50.50 | 48.74 | 52.26 | 52.21 | 104.47 | 90.28 | 101.39 | -11.11 | 43.28 | C |
| HOXIE | 45 | 50 | 48.74 | 50.00 | 47.17 | 55.77 | 102.94 | 105.75 | 100.70 | 5.05 | 53.05 | C |
| HUGHES | 21 | 21 | 41.94 | 41.94 | 27.46 | 32.90 | 60.36 | 47.10 | 81.52 | -34.42 | 29.19 | F |
| HUNTSVILLE | 55 | 47 | 51.26 | 49.25 | 54.45 | 53.64 | 108.08 | 115.84 | 103.02 | 12.82 | 57.75 | B |
| IZARD COUNTY CONS. | 45 | 33 | 48.74 | 45.60 | 47.17 | 43.29 | 90.46 | 113.06 | 95.08 | 17.98 | 60.87 | B |
| JACKSON COUNTY | 54 | 41 | 51.00 | 47.72 | 53.72 | 49.32 | 103.03 | 101.15 | 100.74 | 0.41 | 50.25 | C |
| JASPER | 76 | 51 | 57.06 | 50.25 | 71.26 | 56.48 | 127.74 | 108.19 | 111.87 | -3.69 | 47.77 | C |
| JESSIEVILLE | 65 | 41 | 53.85 | 47.72 | 61.96 | 49.32 | 111.28 | 119.09 | 104.46 | 14.63 | 58.85 | B |
| JONESBORO | 37 | 22 | 46.68 | 42.28 | 41.20 | 33.87 | 75.07 | 106.28 | 88.15 | 18.14 | 60.97 | B |
| JUNCTION CITY | 67 | 55 | 54.40 | 51.26 | 63.54 | 59.34 | 122.88 | 90.78 | 109.68 | -18.90 | 38.57 | D |
| KIPP DELTA COLLEGE PREP | 126.52 | n/a | ||||||||||
| KIRBY | 51 | 43 | 50.25 | 48.24 | 51.53 | 50.77 | 102.30 | 98.48 | 100.41 | -1.93 | 48.83 | C |
| LAFAYETTE COUNTY | 31 | 31 | 45.04 | 45.04 | 36.45 | 41.71 | 78.16 | 62.87 | 89.54 | -26.67 | 33.87 | D |
| LAKE HAMILTON | 56 | 36 | 51.51 | 46.42 | 55.18 | 45.61 | 100.78 | 138.74 | 99.73 | 39.01 | 73.59 | A |
| LAKESIDE (Chicot Co.) | 57 | 50 | 51.76 | 50.00 | 55.91 | 55.77 | 111.69 | 65.89 | 104.64 | -38.75 | 26.57 | F |
| LAKESIDE (Garland Co.) | 54 | 55 | 51.00 | 51.26 | 53.72 | 59.34 | 113.05 | 130.84 | 105.26 | 25.58 | 65.47 | A |
| LAMAR | 47 | 41 | 49.25 | 47.72 | 48.63 | 49.32 | 97.95 | 104.13 | 98.45 | 5.68 | 53.44 | C |
| LAVACA | 54 | 38 | 51.00 | 46.95 | 53.72 | 47.11 | 100.82 | 89.99 | 99.75 | -9.76 | 44.10 | C |
| LAWRENCE COUNTY | 45 | 35 | 48.74 | 46.15 | 47.17 | 44.84 | 92.01 | 94.23 | 95.78 | -1.55 | 49.06 | C |
| LEAD HILL | 35 | 26 | 46.15 | 43.57 | 39.65 | 37.52 | 77.18 | 101.74 | 89.10 | 12.64 | 57.64 | B |
| LEE COUNTY | 20 | 17 | 41.58 | 40.46 | 26.44 | 28.71 | 55.15 | 64.99 | 79.17 | -14.18 | 41.43 | D |
| LINCOLN | 39 | 39 | 47.21 | 47.21 | 42.72 | 47.85 | 90.57 | 106.28 | 95.13 | 11.15 | 56.74 | B |
| LISA ACADEMY | 149.89 | n/a | ||||||||||
| LITTLE ROCK | 31 | 33 | 45.04 | 45.60 | 36.45 | 43.29 | 79.75 | 82.80 | 90.25 | -7.46 | 45.49 | C |
| LONOKE | 49 | 32 | 49.75 | 45.32 | 50.08 | 42.51 | 92.59 | 98.10 | 96.04 | 2.07 | 51.25 | C |
| MAGAZINE | 42 | 33 | 47.98 | 45.60 | 44.96 | 43.29 | 88.26 | 104.94 | 94.09 | 10.86 | 56.56 | B |
| MAGNET COVE | 44 | 27 | 48.49 | 43.87 | 46.44 | 38.39 | 84.83 | 111.53 | 92.54 | 18.99 | 61.48 | B |
| MAGNOLIA | 40 | 30 | 47.47 | 44.76 | 43.47 | 40.90 | 84.37 | 88.38 | 92.34 | -3.96 | 47.61 | C |
| MALVERN | 35 | 29 | 46.15 | 44.47 | 39.65 | 40.08 | 79.73 | 96.70 | 90.24 | 6.46 | 53.91 | B |
| MAMMOTH SPRING | 50 | 66 | 50.00 | 54.12 | 50.81 | 67.47 | 118.28 | 98.89 | 107.61 | -8.72 | 44.72 | C |
| MANILA | 48 | 34 | 49.50 | 45.88 | 49.36 | 44.07 | 93.43 | 100.86 | 96.42 | 4.44 | 52.69 | C |
| MANSFIELD | 47 | 43 | 49.25 | 48.24 | 48.63 | 50.77 | 99.40 | 101.46 | 99.11 | 2.35 | 51.42 | C |
| MARION | 43 | 38 | 48.24 | 46.95 | 45.70 | 47.11 | 92.81 | 111.53 | 96.14 | 15.40 | 59.31 | B |
| MARKED TREE | 32 | 35 | 45.32 | 46.15 | 37.27 | 44.84 | 82.11 | 100.08 | 91.32 | 8.76 | 55.30 | B |
| MARMADUKE | 61 | 47 | 52.79 | 49.25 | 58.90 | 53.64 | 112.53 | 72.30 | 105.02 | -32.72 | 30.22 | F |
| MARVELL | 31 | 26 | 45.04 | 43.57 | 36.45 | 37.52 | 73.98 | 66.00 | 87.65 | -21.65 | 36.91 | D |
| MAYFLOWER | 45 | 24 | 48.74 | 42.94 | 47.17 | 35.74 | 82.91 | 107.90 | 91.68 | 16.22 | 59.81 | B |
| MAYNARD | 39 | 34 | 47.21 | 45.88 | 42.72 | 44.07 | 86.80 | 89.53 | 93.43 | -3.90 | 47.64 | C |
| MCCRORY | 50 | 45 | 50.00 | 48.74 | 50.81 | 52.21 | 103.02 | 118.27 | 100.74 | 17.54 | 60.60 | B |
| MCGEHEE | 59 | 60 | 52.28 | 52.53 | 57.40 | 62.96 | 120.36 | 92.20 | 108.55 | -16.35 | 40.11 | D |
| MELBOURNE | 69 | 69 | 54.96 | 54.96 | 65.16 | 69.84 | 135.00 | 101.13 | 115.14 | -14.02 | 41.52 | D |
| MENA | 61 | 49 | 52.79 | 49.75 | 58.90 | 55.06 | 113.96 | 129.95 | 105.66 | 24.29 | 64.69 | A |
| MIDLAND | 72 | 61 | 55.83 | 52.79 | 67.68 | 63.70 | 131.38 | 99.84 | 113.51 | -13.68 | 41.73 | C |
| MINERAL SPRINGS | 25 | 25 | 43.26 | 43.26 | 31.28 | 36.64 | 67.92 | 69.76 | 84.93 | -15.17 | 40.83 | D |
| MONTICELLO | 45 | 38 | 48.74 | 46.95 | 47.17 | 47.11 | 94.28 | 101.71 | 96.80 | 4.91 | 52.97 | C |
| MOUNT IDA | 54 | 46 | 51.00 | 49.00 | 53.72 | 52.92 | 106.64 | 108.48 | 102.37 | 6.11 | 53.69 | C |
| MOUNTAIN HOME | 49 | 46 | 49.75 | 49.00 | 50.08 | 52.92 | 103.01 | 120.04 | 100.73 | 19.31 | 61.68 | B |
| MOUNTAIN PINE | 36 | 30 | 46.42 | 44.76 | 40.43 | 40.90 | 81.33 | 110.90 | 90.97 | 19.94 | 62.06 | B |
| MOUNTAIN VIEW | 57 | 54 | 51.76 | 51.00 | 55.91 | 58.62 | 114.54 | 123.23 | 105.93 | 17.30 | 60.46 | B |
| MOUNTAINBURG | 34 | 20 | 45.88 | 41.58 | 38.87 | 31.90 | 70.77 | 122.34 | 86.21 | 36.13 | 71.85 | A |
| MT. VERNON/ENOLA | 67 | 62 | 54.40 | 53.05 | 63.54 | 64.44 | 127.98 | 110.72 | 111.98 | -1.26 | 49.24 | C |
| MULBERRY | 28 | 26 | 44.17 | 43.57 | 33.93 | 37.52 | 71.46 92.17 86.52 | 5.65 | 53.42 | C | ||
| MURFREESBORO | 52 | 35 | 50.50 | 46.15 | 52.26 | 44.84 | 97.10 | 107.37 | 98.07 | 9.30 | 55.62 | B |
| NASHVILLE | 42 | 53 | 47.98 | 50.75 | 44.96 | 57.91 | 102.87 | 95.07 | 100.67 | -5.60 | 46.62 | C |
| NEMO VISTA | 50 | 46 | 50.00 | 49.00 | 50.81 | 52.92 | 103.73 | 113.89 | 101.06 | 12.83 | 57.76 | B |
| NETTLETON | 56 | 50 | 51.51 | 50.00 | 55.18 | 55.77 | 110.95 | 111.97 | 104.31 | 7.66 | 54.63 | B |
| NEVADA COUNTY | 38 | 23 | 46.95 | 42.61 | 41.96 | 34.82 | 76.78 | 71.87 | 88.92 | -17.05 | 39.69 | D |
| NEWPORT | 28 | 30 | 44.17 | 44.76 | 33.93 | 40.90 | 74.83 | 90.35 | 88.04 | 2.31 | 51.40 | C |
| NORFORK | 57 | 49 | 51.76 | 49.75 | 55.91 | 55.06 | 110.98 | 121.78 | 104.32 | 17.46 | 60.56 | B |
| NORPHLET | 74 | 71 | 56.43 | 55.53 | 69.43 | 71.47 | 140.90 | 91.57 | 117.80 | -26.23 | 34.14 | D |
| NORTH LITTLE ROCK | 40 | 39 | 47.47 | 47.21 | 43.47 | 47.85 | 91.32 | 84.98 | 95.47 | -10.49 | 43.66 | C |
| NWA ACADEMY FINE ART | 133.63 | n/a | ||||||||||
| OMAHA | 70 | 69 | 55.24 | 54.96 | 65.99 | 69.84 | 135.83 | 102.55 | 115.52 | -12.96 | 42.16 | C |
| OSCEOLA | 21 | 28 | 41.94 | 44.17 | 27.46 | 39.24 | 66.70 | 66.88 | 84.38 | -17.49 | 39.42 | D |
| OUACHITA | 51 | 39 | 50.25 | 47.21 | 51.53 | 47.85 | 99.38 | 104.42 | 99.10 | 5.32 | 53.22 | C |
| OUACHITA RIVER | 37 | 30 | 46.68 | 44.76 | 41.20 | 40.90 | 82.10 | 98.10 | 91.31 | 6.79 | 54.11 | B |
| OZARK | 55 | 51 | 51.26 | 50.25 | 54.45 | 56.48 | 110.93 | 106.31 | 104.30 | 2.01 | 51.22 | C |
| OZARK MOUNTAIN | 41 | 42 | 47.72 | 47.98 | 44.22 | 50.05 | 94.27 | 92.40 | 96.79 | -4.39 | 47.34 | C |
| PALESTINE/WHEATLEY | 26 | 19 | 43.57 | 41.22 | 32.18 | 30.87 | 63.05 | 64.97 | 82.73 | -17.77 | 39.26 | D |
| PANGBURN | 73 | 50 | 56.13 | 50.00 | 68.55 | 55.77 | 124.32 | 98.10 | 110.33 | -12.23 | 42.60 | C |
| PARAGOULD | 50 | 33 | 50.00 | 45.60 | 50.81 | 43.29 | 94.10 | 93.43 | 96.72 | -3.29 | 48.01 | C |
| PARIS | 54 | 59 | 51.00 | 52.28 | 53.72 | 62.23 | 115.94 | 119.55 | 106.56 | 12.99 | 57.85 | B |
| PARKERS CHAPEL | 75 | 74 | 56.74 | 56.43 | 70.34 | 74.02 | 144.36 | 127.35 | 119.36 | 8.00 | 54.83 | B |
| PEA RIDGE | 46 | 47 | 49.00 | 49.25 | 47.90 | 53.64 | 101.54 | 114.71 | 100.07 | 14.64 | 58.85 | B |
| PERRYVILLE | 53 | 33 | 50.75 | 45.60 | 52.99 | 43.29 | 96.28 | 118.73 | 97.70 | 21.02 | 62.71 | B |
| PIGGOTT | 61 | 64 | 52.79 | 53.58 | 58.90 | 65.94 | 124.84 | 98.70 | 110.57 | -11.87 | 42.82 | C |
| PINE BLUFF | 19 | 19 | 41.22 | 41.22 | 25.39 | 30.87 | 56.26 | 65.86 | 79.67 | -13.81 | 41.65 | C |
| POCAHONTAS | 59 | 53 | 52.28 | 50.75 | 57.40 | 57.91 | 115.30 | 99.60 | 106.27 | -6.68 | 45.96 | C |
| POTTSVILLE | 58 | 65 | 52.02 | 53.85 | 56.65 | 66.70 | 123.36 | 137.40 | 109.90 | 27.50 | 66.63 | A |
| POYEN | 62 | 29 | 53.05 | 44.47 | 59.65 | 40.08 | 99.73 | 102.50 | 99.25 | 3.25 | 51.97 | C |
| PRAIRIE GROVE | 64 | 66 | 53.58 | 54.12 | 61.19 | 67.47 | 128.66 | 92.20 | 112.29 | -20.09 | 37.85 | D |
| PRESCOTT | 47 | 55 | 49.25 | 51.26 | 48.63 | 59.34 | 107.97 | 88.21 | 102.97 | -14.76 | 41.08 | D |
| PULASKI COUNTY | 39 | 33 | 47.21 | 45.60 | 42.72 | 43.29 | 86.02 | 81.79 | 93.08 | -11.29 | 43.18 | C |
| QUITMAN | 78 | 51 | 57.72 | 50.25 | 73.16 | 56.48 | 129.65 | 88.51 | 112.73 | -24.22 | 35.35 | D |
| RECTOR | 57 | 34 | 51.76 | 45.88 | 55.91 | 44.07 | 99.99 | 106.82 | 99.37 | 7.45 | 54.50 | B |
| RIVERSIDE | 52 | 55 | 50.50 | 51.26 | 52.26 | 59.34 | 111.60 | 88.78 | 104.60 | -15.82 | 40.44 | D |
| RIVERVIEW | 57 | 61 | 51.76 | 52.79 | 55.91 | 63.70 | 119.61 | 97.29 | 108.21 | -10.92 | 43.40 | C |
| ROGERS | 54 | 46 | 51.00 | 49.00 | 53.72 | 52.92 | 106.64 | 120.04 | 102.37 | 17.67 | 60.69 | B |
| ROSE BUD | 41 | 39 | 47.72 | 47.21 | 44.22 | 47.85 | 92.07 | 90.78 | 95.80 | -5.02 | 46.96 | C |
| RUSSELLVILLE | 53 | 39 | 50.75 | 47.21 | 52.99 | 47.85 | 100.84 | 108.71 | 99.75 | 8.96 | 55.42 | B |
| SALEM | 74 | 63 | 56.43 | 53.32 | 69.43 | 65.19 | 134.62 | 134.27 | 114.97 | 19.29 | 61.67 | B |
| SCRANTON | 87 | 83 | 61.26 | 59.54 | 83.42 | 82.84 | 166.26 | 141.77 | 129.23 | 12.55 | 57.59 | B |
| SEARCY | 56 | 53 | 51.51 | 50.75 | 55.18 | 57.91 | 113.09 | 127.35 | 105.27 | 22.08 | 63.35 | A |
| SEARCY COUNTY | 59 | 48 | 52.28 | 49.50 | 57.40 | 54.35 | 111.75 | 92.60 | 104.67 | -12.06 | 42.70 | C |
| SHERIDAN | 57 | 45 | 51.76 | 48.74 | 55.91 | 52.21 | 108.12 | 119.08 | 103.04 | 16.04 | 59.70 | B |
| SHIRLEY | 93.22 | n/a | ||||||||||
| SILOAM SPRINGS | 52 | 36 | 50.50 | 46.42 | 52.26 | 45.61 | 97.87 | 117.09 | 98.42 | 18.67 | 61.29 | B |
| SLOAN-HENDRIX | 47 | 43 | 49.25 | 48.24 | 48.63 | 50.77 | 99.40 | 80.10 | 99.11 | -19.01 | 38.51 | D |
| SMACKOVER | 43 | 31 | 48.24 | 45.04 | 45.70 | 41.71 | 87.41 | 89.77 | 93.71 | -3.93 | 47.62 | C |
| SOUTH CONWAY | 55 | 52 | 51.26 | 50.50 | 54.45 | 57.20 | 111.64 | 99.84 | 104.62 | -4.79 | 47.11 | C |
| COUNTY
SOUTH MISSISSIPPI |
29 |
24 |
44.47 |
42.94 |
34.79 |
35.74 |
70.53 |
83.83 |
86.10 |
-2.27 |
48.63 |
C |
| COUNTY |
|
|||||||||||||||||||||||||||||||||||||||||||||||||||||||||||||||||||||||||||||||||||||||||||||||||||||||||||||||||||||||||||||||||||||||||||||||||||||||||||||||||||||||||||||||||||||||||||||||||||||||||||||||||||||||||||||||||||||||||||||||||||||||||||||||||||||||||||||||||||||||||||||||||||||||||||||||||||||||||||||||||||||||||||||||||||||||||||||||||||||||||||||||||||||||||||||||||||||||||||||||||||||||||||||||||||||||||||||||||||||||||||||||||||||||||||||||||||||
SOUTH SIDE (Van Buren Co.)
SOUTHSIDE
(Independence Co.) SPRING HILL SPRINGDALE STAR CITY STEPHENS STRONG-HUTTIG
STUTTGART TEXARKANA TRUMANN TURRELL TWIN RIVERS TWORIVERS
VALLEY SPRINGS VALLEY VIEW VAN BUREN
VAN COVE VILONIA VIOLA WALDRON WARREN
WATSON CHAPEL WEINER
WEST FORK
WEST MEMPHIS
WEST SIDE (Cleburne Co.)
WESTERN YELL COUNTY
WESTSIDE (Johnson
Co.)
WESTSIDE CONS.
(Craighead Co.) WHITE COUNTY CENTRAL WHITE HALL WICKES WONDERVIEW WOODLAWN WYNNE
YELLVILLE-SUMMIT
n = Mean =
Standard Deviation =