

Author: Mark Witkowski July 2007
Summary: This study relies on Spring 2006 testing data fromArkansas students taking the Iowa Tests of Basic Skills to evaluate the performance of 251 K-12 public school districts. Using a standard distribution, 14 districts earned A or A- grades; 61 districts received 8+, B or 8- grades; 111 districts earned C+, C or C- grades; 47 districts received O+, D or 0- grades; and 18 districts were assigned failing grades of F. Using a modified distribution, 14 districts earned A or A grades: 79 districts received B+, B or 8- grades; 110 districts earnedC+. C or C- grades; 35 districts received D+, 0 or 0- grades; and 13districts were assigned failing grades of F.
Education refonns discussed in this paper include charter schools, inter district schoo.l choice, home schooling and publicly-funded vouchers.
ARKANSAS 2005-06 SCHOOL DISTRICTGRADES
INTRODUCTION
As noted last year in this report grading Arkansas public schooldistricts, the failure of the 1983 Education Standards Committee chaired by Hilary Rodham Clinton, and subsequent proposals, is underscored by two Arkansas Supreme Court decisions since2002. The Court, in both decisions found the state’s K-12 publicschool system unconstitutional1. The Court’s first ruling led to reforms including Public Act 35 of 2003 (Second Extraordinary Session), sponsored by state Senator Steven Bryles, 0-Blytheville. The Act requires transparency for every Arkansas public school district In the areas of academic and fiscalperformance but does not require a letter grade for districts. PA 35 and other legislative measures are significant steps on theroad to education reform. But the Court still held that Arkansas’ K-12 system was unconstitutional.
This study’s purpose, for the second year in a row, is to create a letter grade for each district, and to discuss policy options forthose on Alert (D grade) or in Distress (F grade). Nine years ago,In 1998, the Murphy Commission, a Policy Foundation project,recommended establishment of a K-12 school district academicratings and Diggers using the following criteria:
Academic Success: Majority of Students scoring 1O or morepercentage points above the 5011percentile on a nationalreading/comprehension/writingandmathematics test.
Academic Competence; Majority of Students scoring at or abovethe so” percentile on a nationalreading/comprehension/writingand mathematics test.
Academic Weak: Majority of Students scoring between the40111and 49111percentile on a nationalreading/comprehension/writing and mathematics test.
Academic Alert: Majority of Students scoring between the 30thand 39111percentile ona national reading/comprehension/writingand mathematics test. Ifimprovement does not occur in one year, the district is placed onAcademic Distress.
Acade.mic Distress: Majority of Students scoring below the 301hpercentile on a national reading/comprehension/writing andmathematics test. Director, Department of Education, mustintervene after two years of no improvement.2
1Ma. Ctinton et1111<lld the Education Standards Committee. In Dupree v Alma School DistrictNo. 30, the state Supreme Court found the school finance system violated the ArkansasConstitution’s equal protection clau&e. (Dupf96 v Alma School District No. 30, 651 S.W. 2d 90 (1983)). Lake View was filed In 1992. In 2002, a Supreme Court majority citied Dupree infinding H had juri8didlon In Lake View. The Court upheld a lower court ruling that found the pt.tllic K-12 school system “Inadequate” and “Inequitable: In Oecel’rber 2005, theCourt again found1he state’s school system UllCllnstitutional.The Court finally found the K-12 syslemconstitutional emlier this year.
‘The Murphy Commi,;sion’s Education Committee recommended using the·StanlordAchievement Test (SAT). Each category corresponds to the following grade&: (A) AcademicSuccess, (B) Academic Competence, (CJAcademic Weak, (0) Ac.demic Aten, and (F) AcademieDiStress. (As of fall 2004. the Arkansas Department of Education has chosen to use the Iowa Basie Skill Test (IBST) Instead of the SAT. The lnfonnatlon pro\iled by 1lle IBST doesnot provide percenUlescores in the format used by SAT.
Therefore, different statistical criteria were developed for inplementing thereconwnendedgrading system asexplmedlater.
Economists have long recognized education’s importance to economic prosperity and a higher standard of Jiving. Dallas Federal Reserve System economist Dr. Michael Cox, a graduate of Little Rock Central High School, has noted thelikelihood of Americans achieving upward income mobilityand a rising standard of living is dependent on educationalachievement “What D’Ya Know? Lifetime Leaming in Pursuit of the American Dream”). Dr. Cox notes individuals in the age group of 25 to 34 with a bachelor’s degree earn 63 percent more than a high school graduate and 100 percent more than a high school dropout. An individual with a graduate degree would earn 90 percent more than a high school graduate and 140 percent more than the high school dropout. These differences in earnings increase as people age. Compared to other states Arkansas’ college graduation rate• is significantly below the national average of 26percent as is our state per capita income level of
$25,7256 versus the national 2004 per capita income level of 32,937. One key step that could significantly increase our state per capital income level versus the rest of the nationwould be to increase our state’s level of college graduates. Of course to increase the number of people in Arkansas with bachelor’s degrees the high school students must be prepared for entering and succeeding/graduating in/fromcollege.
Lower unemployment rates are another benefit associatedwith higher levels of educational achievement. Dr. Cox notes, “Jobless rates are also lower for workers with more years of schooling, largely because they’re more in demand…e As our world is driven more and more by technological advances, the importance of a quality and advanced education will become even more crucial. Howwell Arkansas’ schools. in parUcular its public schools,perform the task of educating our children so they are equipped with the skills, knowledge and aptitude necessary for successfully completing four years or more of college studies is of critical importance.
The Policy Foundation recommended in 1998 that the legislature adopt education reforms including transparency and accountability. Several Murphy Commission recommendations have been enacted by the legislature and signed by ex-Gov. Mike Huckabee. They create schooldistricts that are more accountable, transparent, and that provide additional options for public school students and their parents.7 The Policy Foundation filed two amicus curiae briefs with the Supreme Court in the Lake View casethat discuss some of these ideas. These measures are important first steps toward addressing the constitutionaldeficiencies identified in Court rulings. Additionaleducational
- Dr, Michael Coxis the Senior Economist for the Fe<leral Reserve Bank of This articleappeared In lhe Bank’s 2004 AnnualReport, pages 5 through 23. •
‘ 19.7% in 2002 according to U.S. Census Bureau Ranking Table: ‘Percent of People 25Yeal’ll and Over Who Have Completed a Bachelo(s Degree (State Level).
- U.S. Census Bureau “Change In Per Capita Income by State: 1999-2004”
- tbid. “UfeUme Leaming•, page 7,
These reforms include PA Act 35 of 2003 (Second Extraordinary Seasion) and PA Act 2005 of 2005. PA 35 eXPands district transparency, and features accountabilily measures induding rewards and sanclions for performance. PA 2005 eitpands the noo,ber of charter schoolspermitted in Arkansas. Sen. Brytes sponsored both measures, Another reform, PA
60 of 2003 (Second Extraordinary Session) sponsored by stale Rep, \JI/ill Bond, D-Jaci(sonviUe. has led to the restructuring of districts and their adminiatratora.
reforms are necessary. In that regard this paper assigns a letter grade for each Arkansas K-12 public school district. It concludes with a brief review of other education reforms proposed by the Murphy Commission in 1998 or enacted in other states.
EVALUATIONfGRADING PROCESS
This study relies on Spring 2006 testing data derived from students taking the Iowa Test of Basic Skills (ITBS) to grade the performance of 251 Arkansas public school districts in the 2005-2006 academic year. In 2006 a complete set of tests were administered to students in grades kindergarten through ninth grade. In 2005, Arkansas public schoolstudents were tested using only about half of the ITBS exam.Therefore, comparing Arkansas ITBS score to the nationalmean is more relevant in 2006 versus the Arkansas test scoreresults in 2005. This change in Arkansas testing using the complete, instead of partial ITBS most likely explains thedifference in school district grades for 2006 scores versustheir grades for 2005 scores. Statistically8, at a 95 percent confidence level there was a significant change in the totaldistribution of grades in 2006 versus 2005. The number of districts receiving a grade of A or A- fell from 20 districts in2005 to 14 districts in 2006. The number of districts receivinga B+, B or B- changed from 104 districts in 2005 to 79 in 2006. Districts with F grades increased from nine9 to 13.Other potential factors such as the exam content, which did not change from 2005 to 2006; and the percentage of ;African American students which did not change significantly, cannot explain this change in the number of schools pergrade classification.
The school and district test scores are reported in threedifferent formats: (1), Standard Scores (SS)10, (2) Normal Curve Equivalent scores (NCE), and (3) percentile scores.For purposes of this study, Standard Scores were utilized. Although parents and teachers may be more familiar withpercentile scores they do not provide statistically meaningful measures such as the standard deviation or mean. NCE scores, which are derived from SS scores, can be used in a statistical manner such as averaging. Since SS scores are the basic building block from which NCE and percentilescores are derived ii is logical to base this study on SS scores.
One consideration in determining which school districts havebeen successful is whether to use a district score whichincluded all students taking the ITBS, one based on a subsetof grade levels or a single grade level. All grade levels are important in the development of a child’s education, whether it be first grade or twelfth grade. However, in determining which school districts are or are not preparing their students for economic well being once they leave their local public school district, the most appropriate grade level or levelswould be those
8 This was determined using the Chi Squared Statistical Method.
9 Of the nine districts receiving an F In 2005, six received an F in 2006. One dislrid, Parkin, was merged. England improved from an F in 2005 to a O in 2006 and Altheimer Unified went from an FIn 2005 to a o. (F in language and O in malh) in 2006.
- • SS test scores can range from 80 to 400. Each grade level has its own mean v,tiieh increaseswithgrade levels.
grade levels closest to their graduation, preferably the high school years, or twelfth grade. For the 200!>–2006 school year ninth grade was the highest grade level at which the ITBS was given to Arkansas’ public school students.Therefore, ninth grade SS scores were used to evaluate the performance of Arkansas’ public school districts. In the same manner in which students are graded with As, Bs, Cs, Ds, and Fs, this study grades Arkansas’ 251 public school districts. As noted in the following table, 14 of Arkansas’s public school districts were given grades of A or A-; 79 grades of B+, B, or B-, 110 grades of C+, C, and C-; and 48 grades of O+, D, 0-, • and 11 districts earned a grade of F.’
Page 51 of Iowa Forms A and B, Levels 15 – 17/18 notesthat the norm/mean SS score for ninth grade students is260 points. Given that Arkansas public school students tookthe ITBS exams12 approximately a month earlier than the time period associated with the national norm/mean SSscore of 260 points, the appropriate SS norm/mean score toevaluate Arkansas test scores by is 25913 points..The totalninth grade lan uage mean SS score for Arkansas’ 251public school districts was 256.1 points 4. The total ninthgrade math mean SS score for Arkansas’ 251 public schooldistricts was 261..5 points.15 For the total ninth gradelanguage exam, 136 of Arkansas’ public.school districtsscored higher than the national norm/mean, and 115 scoredbelow the national norm/mean. For the total ninth grade math exam, 161 school districts scored above the nationalnorm/mean, 89 scored below the national norm/mean, andone equal to the national norm/mean.
To determine the appropriate grade for each school district the properties of the standard normal distribution curvemethod were utilized. This method assumes that fiftypercent of the scores should be below the mean/norm and fifty percent above. Another property of the standard normal distribution curve is that the further the score/valueis above or below the norm/mean score, the smaller the frequency. As noted earlier the appropriate SS mean score for the grading of ninth grade students is 259 points. Onebasic assumption made for this study
- is that scores at or close to the mean/norm of 259 points represented an average performance or the equivalent of a C grade. Therefore, scores somewhat about the mean • • • are equivalent to B grades and scores significantly higher than the mean would be equivalent to A grades. Conversely, grades somewhat below the mean/norm would be equivalent to D grades and scores significantly below the mean/norm would be equivalent to F grades. Traditionally, scores/values in the highest or lowest 5 or 10 percent are considered to be significantly above orbelow the norm/mean. For determining at what value the top 10 percent of the scores should begin at the standard deviations of Arkansas’ public school district languageand math scores were
- Detailed lnfonnatlon on rrss SS scores and other school di.trict infonnalfon is presented In App&n<lxOne.
12 Manses ninth grade public IIChool students four of the nine exams in spring 2005. In spring 2006.Arkan888 ninth
F,bllc school students took al nine exams.
3 Arkansas Benchmark proVlded by Iowa Tests of Education Development Reseerch Department, See Attachment OM
” Data provided at the Arlcansas Department of Education web sit&.
15 Data provided at the Arkansas Oepa,tment of EducaDonweb site.
calculated, which were 10.735 and 11.207 respectively. Avalue equal to 1.282 times language score standarddeviation 10.735 plus the national norm/mean of 259 points (272.8 points) is equal to the SS score to be reached for a school district to receive an A math grade. This method wasused to determine values and ranges of SS scores for othergrades, i.e. for a math grade of B, a district’s SS score should be equal to or greater than 263.1 and less than272.8.16
School districts with grades of A or A- are classified as “Academic Success”. Districts with grades of “B+, 8, B-” areclassified as “Academic Competence”. Districts with grades of “C+, C, and C-” are classified as ‘Academic Weak”. Districts with grades. of “D+, D, and D-” are classified as “Academic Alert”. Districts with the grade of F are classified as “Academic Distress”. Using this method, 14 Arkansas public school districts were classified as “Academic Success•, 79 districts as “Academic Competence”, 110 districts as “Academic Weak’, 11 are between “AcademicWeak” and Academic Alert”, and 37 are either •Academic Alert” or “Academic Distress”.
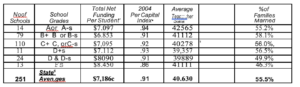
Two measures shown in Table One support these findings. They are student remediation percentiles in math and English, and ACT composite scores. These measures are noted in the following table. Higher than normal remediation percentiles and lower than norm ACT scores would be further evidence that school districts are not preparing their students adequately for higher education and the workforce.For the 37 “Academic Alert or Distress” dhltricts approximately three-fourths of their graduating students were required to take either a remedial coursein math or English or both. The approximate average ACT score for the 37 districts in distress was approximately 17.B points or approximately the bottom 12th percentile.One unexpected relationship in Table One is that while the 37 districts in distress have lower per capita incomes these districts spent more than A, B, and C districts. Spending more per student has not improved perforrnance.17
|
Table One {Modified Distribution)

18 The percentage values for aasigning grades, as noted in the Appendix, were stop 10%,’A’: 65% to 89.9%, “8′: 20% to 64.9″/4, “C’; 5% to 19.9%, “D”: and less than 4.99%, “F”, This distribution doesnot reflaet a true Slandard normal diatribution cun,e In that the top 10% of SSscores receive an A grade and the bottom 5% rea:ived an F grade. In addttion scores from 50% to65% received C grades and scores from 20% to 50o/o received C grades. Thus, compared to astrict standard normal distribution cun,e. the assignment of grades in this study were somewhatskewed towards higher grades. In Appendix Two is a table comparing the grade outcomesversus a modified distribution versus a non-modified/standard grade distribution.
17 ‘Money and School Pe<formance: Lessons from the Kansas City DesesregationExperiment”, Policy Analysis, Cato lnstttute·, Number 298.
- The ADA Total Net Funding values do indude Title I and Title VI • State Avereges forlhe Language and Math SS scores were calculated using each of the 251 public schooldistrict vales·at equal weights. All other averages were weighted calculations reflecting thenumber of districts per Grade Category.• Per Capita Index Is calculated by dl11lding 2004county per capita income by the 2004 state per capita income $25,814 per the U.S. Census. The stale aver8’g8 weighted per capita Income according to grade category does not equal 1.00 since all school dl.stricts within grade categories were weighed equally, I.e. did not reflectstudent enrollment sizes, Which Is representative of populationdiffenences per county.
Other characteristics stand out for the 37 districts indistress versus other districts. These are shown in TableTwo. The percentage of families married
decreased. In terms of teacher’s salaries per a9radelevel there was no significantly difference at a 95°/o levelof confidence1 .
|
Table Two
“‘”The Total Net Funding values do include Trtle I end Tide VI funding. “State Averages for the Language and Math SS scores were calculated using each of the 251 publicschooldia1rictvales al equal weights. All other averages were weighted calculations reflectwlg thenumbe< of districts per Grade Category. ‘Per Capita Index Is calculated by dl11iding 2004coullty per capaa in= by the 2004 state per capita lnoome of $25,814 per the U.S. Census.The state average weighted eccotding to grade cetegory does not equal since all schooldistricts within grade categories were weighed equaRy, i.e. did
not reflect student enrollment sizes•. Salary dollars were obtained from Arkansas O&partmentof Education Annual 2004 –
2005 Statistical Report. The average teacher salaries were for non-certified ful timeeducators. This sala,y level is approximately 5% high&r thantrad ional le-12 full-limeeducato,s.
COMPETITION AND SCHOOL CHOICE
We expect to and do have choices in this society. These include the radio station we listen to, the stores where weshop, the restaurants where we eat our meals, the colors and options we desire to have in a new car, the area of town we live in, or the college or university our children decide to attend. In our economy and nation, it is the consumer who determines the direction the markets follows. Given consumer choice, producers and suppliers of the products and services are motivated and driven to provide an affordable and quality product or service, which meets ourwants and desires. The competitive marketplaceencourages innovation, creativity, more knowledge. Not to doso is short sighted by the producer. When a producer is notmeeting our expectations we move to another unless that company Is a government monopoly such as Arkansaselectric companies or the US Postal Service (USPS).
19 This was detennined using theChi Squared Statistical Method.
6
In recent decades the Federal Government has allowed private firms to compete with the USPS for delivering packages, but not first class mail. In general most would agree that the competition for moving packages has benefited the consumer with more mail locations, more productivity, and lower costs. Our national K-12 and higher education systems and institutions compare similarly to themoving of packages and first class mail. At the higher institution level competition has been in place since the beginning of our nation’s history when only private colleges and universities had to compete with one another. The beginnings of Yale were based some students and others dissatisfaction with Harvard, its predecessor. Today, higher education is more competitive than ever as witnessed by the competition of some 20 four-year colleges anduniversities in Arkansas. The schools with the brightest andmost students generally win. The way to attract the brightest and most students is for the colleges and universities toimprove and win the students’ and ·parents’ confidence.This competition is working in the higher education system that includes both private and public colleges and universities competing with one another and not just private versus private. There are more foreign students enrolled In U.S. colleges and universities, whether public or private.American K-12 public schools are rated inferior to those of most developing natlons19, especially in science and math, yet many students from other nations choose to be get theiradvanced degrees in the U.S. at a great financial and socialcost.
But for K-12 education, which in essence is government-approved monopoly with a captive tax base, how many of the parents who send their child to a particular public schooldo so because that school has earned their allegiance? Orare many, If not most of these students attending public schools because for most their families have no other viable choice? The lack of choices in K-12 education in Arkansas for all parents is fundamentally opposed to the basic American psyche of choice. Thomas Jefferson seemed tothink so. In a letter he wrote to Joseph C. Cabell in 1816,Jefferson warned against schools being managed by Governors and Councils to the determent of the parents, because it was a belief against all experience. He said, “Whathas destroyed liberty and the rights of man in everygovernment which has ever existed under the sun? Thegeneralizing and concentrating of all cares and powers intoone body.”20 Nobel Pri economist Milton Friedman, achampion of competition, proposed 50 years ago that thebest education for America’s K-12 students would comefrom, “giving each child, through his parents, a specified sumto be used solely in payment for his general education…Theresult would be a sizeable reduction in the direct activities of government, yet a great widening in the educationalopportunities open to our children.”
How free are Arkansas families to make K-12 education choices? How many choice options do the families living in failing or near failing school districts have or are they lockedin to the present structure? How many students inArkansas
- • OCEO Report, ‘Education Statistics and lncliceto111•, Out of 29 Economieally DevelopedNations. US 15 year olds ranked 24th, page 14. Only one of Iha other 28 nations spends more percapital in education children, Switzerland, than the US, g,age 28.
School ChoioB Advoc8’tJ, March 2005, page 10. Emphaala added.
will be put at a distinct disadvantage in their pursuit of theAmerican Dream due to a poor education? How can thisquestion be measured and answered?
Dr. Jay P. Greene21 in 2000 coined the term the “Education Freedom Index” or EFL In his paper, Dr. Greene evaluated five options of education choice. These included (his order}:
- the availability of charter school options;
- the availability of government assisted private school options;
- the ease with which one can home school their children;
- the ease with which one can choose a different publicschool district by relocating; and
- the ease with which one can send a child to a different publicschool district
without changing residence.
This paper reviews four of the five options: charter schools; inter-district public school transfers; home schooling; and publicly funded vouchers. The assessment of the availability of these school choice options for Arkansas children isdetermined by comparing their choice options to other states.
Charter Schools
Nationally there are approximately 3,400 charter schools in the U.S. educating close to a million children in 40 states andWashington D.C.22 In Arkansas, as of this fall, there arecurrently 18 charter schools in operation. Legislation23 in 2005 authorized the establishment of another six charter schools. One additional charter school has been approved for the 2006-2007 school year. Are charter schools a goodchoice option for Arkansas students? Should the state be encouraged to authorize more? As noted in a study24released in December, 2004 by Caroline Hoxby, HarvardUniversity, in established charter schools, “ten percent more of the students in charter schools are proficient on stateexams than those in neighboring public schools when acharter school has been in operation nine years or longer..e Inaddition, Hoxley noted that, “People involved in charterschools tell you that they improve a lot each year In their
early years in operation, they might cope with issues like finding abuilding. But
after that, they focus on achievement and it shows..a5 Furthermore, as noted by the in a 2004 report commissioned by the U.S. Department of Education, charter schools…serve a disproportionate and increasing number of poor and minority students…andthat the greatest achievemen ains canbe seen among African American, Hispanic, or low-incomestudents.”
21 Dr. Jay P. Greene is the Endowed Chair and Head of the Department of Education Reform at theUnlvenslty of Ar1<ansas, College of Education and Health Profeuiooa. Prior to that at the time thisarticle was written, Dr. Greene was a seni0< fellow
,J the Manhattan Institute for Policy Re&earch.
Center for Education Reform, *CER Quick Facis. All About Challer Schools*, Febru&ry 11. 2004, page 1.
23 Senate Bil 1130. State of Ari<ansas 86°’ General Aasembly, Regular $e11$ion, 2005.
24News Release, December. 2004by “Program on Education Policy and Govamance, Haival’dUnlveniity”. p. 1.
2$ Ibid., p. 1.
26 Center for Educellon Reform, *CER Quick Fads, Aft About Charter Schools”, January 25, 2005,page 1.
The formal history of Arkansas charter schools began in 1995.Today, there are only 18 charters In existence, with six more approved. How does Arkansas’ treatment of the charter school choice compare to other states? In a study27performed by the Center for Education Reform (CER) in 2004,the 40 states and Washington DC, which allow charterschools, were ranked and araded in terms of the effectiveness their charter schools according to . 10 criteria such as number of schools allowed, legal/operational autonorny, etc. States received grades of either A, 8, C, D, or F. In this study six states received A’s, fourteen states Bs, thirteen states Cs, six states Ds, and two states received failing grades. Arkansas ranked 3411> in a survey of 40 states and the District of Columbia, and received a D grade. Thus, Arkansas’ K-12 students are at a disadvantage when trying to use the charter school choice option.
Inter-District Public School Transfers
Another school choice option that is becoming more popular is inter-district transfers from ooe public school to another or from one public school district to another. Generally these programs allow parents to move their children from the school they were assigned to another one in their district or into a public school district that is contiguous to the one they live in.What conditions need to exist prior to a student transferring from one public school district to another vary from not having to give a reason to their current school district to being classified as academically failing or being in financial distress.In Arkansas, parents and students were permitted to transfer to a public school district they did not reside in beginning in the 2003 school year28. The nonresident district has theoption to accept the transferring student. In addition, this Actcontains many restrictions prohibiting parents and students from asking for an inter district transfer. According to theArkansas Department of Education (ADE) for the 2004–2005 school year approximately 2,600 students participated in the inter-district public choice program. Information for the 2005-2006 is not unavailable. Since Arkansas inter-district public school transfer program has been in existence for onlyseveral years it would be premature to issue a grade.
Home Schooling
The third method of school choice is home education/schooling. Home schooling is legal to some degree in all fifty states. Approximately 2 million29 children are home schooled in the U.S.. The laws allowing families to choose this option vary from state to state. Some states required little or no notification to the state or the publicschool districts, the children reside in, or supervision of hometeaching by some public institution in that state. However, a few states do make difficult to home school by requiringexcessive reporting requirements, etc. The Home School Legal Defense Association (HSLDA), which has supportedthe concept of home schooling for over 20 yeara, ranked
77 Center for Education Reform, ‘CER Press Release, Strong Charter School LewsBoostAchievement”. February 11, 2004.
,a Senate Bill242, “An Act to Require All School Districts to Participate In PubHcSchool Choice; and for Other Purposes”, Senator Jim Argue.
‘9 Home School Legal Defense Association (HSLA) report.
9
states as being either home school fTiendly or unfriendly to homeschooling30. HSLDA developed four levels of home schoolacceptance. Twelve states were rated as being very friendly to home schooling, 13 states and DC as being friendly to home schooling, 15 states as being somewhat friendly to home schooling, and 11 states as being unfriendly or difficult to home school in. HSLDA determined that Arkansas was a somewhat homeschool friendly state. According to the Education Alliance31approximately 14,000, or more than three percent of Arkansas’ school age children are home schooled.
Publicly Funded Vouchers
The fourth choice option proposes the use of vouchers that wouldgive parents the ability to send their children to the public or private school of their choice. Eleven states and Washington D.C.32, as of Fall 2005 have approved the use of state and/or local and federal(D.C.) public funds for families to remove their children .from public schools to private schools, and in some states religious schools.Approximately 675,000 students in .these states and DC have exercised this school choice option.
The use of publicly funded vouchers for enrollments in privateschools, including religious has been challenged in eight of theeleven states authorizing their use. The use of publicly funded vouchers for sending students to private schools was upheld in sixstates by either •.• • . _, a state Supreme Court or the U.S.Supreme Court. In addition, in three of those six rulings it was determined that using publicly funded vouchers for enrolling students in religious schools was not a violation of the First Amendment of the U,S. Constitution. In particular, the U.S. Supreme Court ruled in 2002 in the Cleveland Voucher Case that school choice programs are constitutional when they give parents a truly independent choice of schools among a wide array of options without favoring or disfavoring religion. This choice option of allowing parents to use pubricly funded voucher for transferringtheir children out of falling public school districts to privateschools, religious or not, is not available to Arkansas parents and students at this time. Along with the other 39 states that do not allow the use of publicly funded vouchers for transferringstudents out of failing public school districts, Arkansas shouldreceive a no-pass grade.
School Choice Record
The arguments against school choice, in particular charter schools and vouchers generally focus on what happens to the public schools when students leave for private and religious schools.Students in urban areas like Milwaukee or Cleveland who switched from public schools to charter, private and religious schools reached significantly higher levels of achievement. In a reportpublished in May, 2004 by Education Wee/<33, “Chicago students who transferred to hlgher-perfonnance public schools under a provision of the No Child Left Behind Act, saw much strongerachievement gains overall during
ac HSLDA Home page map.
a, Education Alliance Is affifiatedwith Arkansas Family Council.
32Information provided by “The School Chclce Advocate• published by MIiton and Rose 0. FriedmanFoundation.
.. Educalfon W””‘1. is published by Editorial Projects in &:Juc411on,Inc. •
10
first year of the program in their new schools than the year before.”In the Chicago School System, the third largest in the nation, in the 2005-2006 school year, “far fewer students, (175,000), than thenumber of slots (500), will get a chance to transfer out of low-performing schools”.34 The traditional argument that’s left against school choice options is that the public schools which lose studentswill suffer in their ability to properly educate the remaining studentsand that student achievement levels at these schools will fall.
In the 2004 study of Chicago public schools it was determined that “the schools losing/sending students scored significant gains in reading and math scores36. Public schools across the state of Florida have experience similar results. Jay P. Greene and Marcus A. Winters of the Manhattan Institute for Policy Research36 foundthat falling/low performing public schools that children were allowed to transfer from showed greater gains in the state’s Florida Comprehensive Assessment Test (FCAT) than schools deemed not at risk. That “these inprovements are real, not the result of testgaming, demographic shifts, or the statistical phenomenon of “regression to the mean”.37 Thus, current evidence indicates that the transferring students on average achieve higher test scores and that the losing/sending districts perform better as well. Therefore, the hypothesis that making K-12 education more competitive by offering parents education choices, such as charter school, inter-district transfers, home schooling, and publicly funded vouchers would result in more effective public schools is hard to dispute. When does competition not challenge the parties involved to improve and do their best?
CONCLUSION
In December, 2005, the Arkansas Supreme Court found the state’s K-12 school finance system unconstitutional for the second time inthree years in the Lake View School District case, as it did twenty-two years ago in Dupree v. Alma in 1983. As noted by Or. Cox in this paper, the importance of a quality education for the individual to achieve their “American Dream• of upward mobility and a risingstandard of living has become more and more critical.
The Arl<:ansas Legislature’s response to these rulings isincomplete. Positive developments include administrative restructuring and charter school expansion. But negatives includenot developing a system for assigning letter grades to each district, and failing to provide disadvantaged children in deficient districts with more options.
Based on spring 2006 ITBS scores, 37 Arl<:ansas public schooldistricts were found to be deficient in providing a quality education for its ninth grade students. In order for the ninth graders and allother students in these 37
34 Ibid.
.. ,bid.
Publiahed In August, 2008.
., Ibid.
11
districts to be able to pursue a lifetime of quality learning, theparents should have the ability to tum to another source/supplier, whether it be another public school district ora private religious school. Full school choice should not beonly for those who can afford it. As school choice is expandedin Arkansas, those who stand to gain the most will be those who today are trapped in a failing school with no knowledge or means of hope. As school choice expands in Arkansas, allschools whether public or private, will be pushed to excel to be competitive and more accountable to Arkansas parents. In addition wheri the consumer has choice avaUable to them it naturally creates more choices for the consumer/parents and students. With more school choice options, Arkansas hasmuch to gain and little to lose. In the words of Milwaukee Mayor John Q. Norquisf’: “America’s children are tooimportant to leave trapped In a monopoly system we know is harmful to them. Milton Friedman pointed us toward educationexcellence. Now it’s time to get to our destination.” Until these reforms are enacted and followed the Arkansas Policy Foundation will continue to grade Arkansas’ public schooldistricts for the benefit of their students and their parents.
Table Three Comparing the Grading of Arkansas School District FOR 2006
NinthGrade According toDistribution Method
| Gradecategory | Ni.mberofGrades (Non-Modiffed Distribution) | Number of Districts
(Modified Distribution) |
Variance Between Non-Modified Gradee V1lrSUS MoclfledGrades | ||
| As | 14 | 14 | 0 | ||
| Bs | 61 | 79 | -18 -29.6″.4\ | ||
| Cs | 111 | 110 | +1 +.9%) | ||
| D+s | 12 | 11 | +1 | +8.3% | |
| DI andD-s | 35 | 24 | +11 (+31.4 | ||
| Fs | 18 | 13 | +5(27.8% | ||
| Totals | 251 | 251 | -0- | ||
‘”Johna.Norquist served as Mayor ol MIiwaukee from 1998 to 2003. He la culTently the president andCEO of lhe “Congress forNew Urbanism”, a norvofit Ofganiza1ion basedin Chicago.
12
p- One. App,tnlix One
Appendix One: Modified
Analysis of 2006 Iowa Test of Basic SkillStandard Scores for Grading Arkansas’ 251 Public School Districts
Based on Ninth Grades ITBS StandardScores
And a Modified Standard Normal Bell CurveShape Distribution
|
||||||||||||||||||||||||||||||||||||||||||||||||||||||||||||||||||||||||||||||||||||||||||||||||||||||||||||||||||||||||||||||||||||||||||||||||||||||||||||||||||||||||||||||||||||||||||||||||||||||
–
|
No, |
SchoolDistrictNamesWith
Combined B+,B or B- Grades “AcademicCompetence” |
District Language Standard Scorn | District Language Gradea | DistrictMath Standard Scores | District
·Math Grades |
Combined
District Standard Scores |
Combined
District Grade |
|
| 1 | LAKEHAMILTON SD | 271.5 | B | 274.6 | A | 546.1 | B+ | |
| 2 | MOUNTAINVIEW SD | 269.2
270.4 |
B | 276.8 | A | 54-6.0
545.8 |
B-t- | |
| 3 | MOUNTAINHOME SD | B | 275.4 | A | B+ | |||
| 4 | SCRANTON SD | 269.8 | B | 275.9 | A | 545.7 | B+ | |
| 5 | CUSHMAN SD | 269.8 | B | 275.4 | A | 545.2 I B+ | ||
| 6 | MELBOURNESO | 273.3 | A | 271.9 | B | 545.2 | B+ | |
| 7 | CLARKSVILLESD | 267.1 | B | 2TT.4 | A | 544.5 | B+ | |
| 8 | DARDANELLESD | 266.7 | B | 277.2 | A | 543.9 | B+ | |
| 9 | BERGMAN SD | 267.5 | B | 276.3 | A | 543.8 | B+ | |
| 10 | GR.EENBRIERSD | 267.8 . | B | 275.0 | A | 542.8 | B+ | |
| 11 | WHITE HALL SD | 269.1 | B | 273.6 | A | 542.7 | B+ | |
| 12 | BRYANT SD | 266.9 | B | 274.8 | A | 541.7 | B+ | |
| 13 | LAMAR SD | 267.1 | B | 274.6 | A | 541.7 | – B+ | |
| 14 | FOUNTAINLAKE SD | 266.7 | B | 274.8 | A | 541.5 | B+ | |
| 15 | PEA RIDGE SD | 265.7 | B | 275.1 | A | 540.8 | B+ | |
| 16 | CHARLESTONSD | 264.5 | B | 276.1 | A | 540.6 | B+ | |
| 17 | VAN COVE SD | 266.1 | B | 274.3 | A | 540.4 | B+ | |
| 18 | NORFORK SD | 265.2 | B | 274.7 | A | 539.9 | B+ | |
| 19 | EMERSON-TAYLOR | 271.0 | B | 270.8 | B | 541.8 | B | |
| 20 | MANSFIELD SD | 268.3 | B | 272.5 | B | 540.8 | 8 | |
| 21 | MTVERNONENOLASD | 268.1 | B | 272.7 | 8 | 540.8 | B | |
| 22 | SALEM SD | 262.2 | C | 278.6 | A | 540.8 | .-· 8 | |
| 23 | PARKERSCHAPEL SD | 272.1 | B | 267.8 | B | 539.9 | 8 | |
| 24 | SEARCY SD | 266.5 | B | • 273.1 | 8 | 539.6 | 8 | |
| 25 | GREENE COTECH SD | 267.5 | B | 271.4 | 8 | 538.9 | B | |
| 26 | CEDARVILLESD | 268.7 | B | 270.1 | 8 | 538.8 | B | |
| 27 | CADDO HILLSSD | 261.9 | C | 276.8 | A | 538.7 | B | |
| 28 | BERRYVILLESD | 267.7 | B | 270.8 | B | 538.5 | B | |
| 29 | HARRISON SD | 267.2 | B | 271.3 | B | 538.5 | 8 | |
| 30 | BATESVILLE SD | 267.6 | B | 269.9 | B | 537.5 | B | |
| 31 | SOUTH SIDE SDBee Branch | 267.0 | B | 270.3 | B | 537.3 | 8 | |
| 32 | ARKADELPHIASD | 268.5 | B | 268.7 | B | 537.2 | B | |
| 33 | CABOT SD | 265.1 | B | 271.9 | B | 537.0 – | B | |
| 34 | BENTON SD | 261.9 | C | 275.0 | A | 536.9 | B | |
| 35 | WALNUTRIDGE SD | 265.3 | B | 270.8 | B | 536.1 | B | |
| 36 | JONESBOROSD | 264.8 | B | 271.0 | B | 535.B | B | |
| 37 | POYEN SD | 263.2 | B | 272.0 | B | 535.2 | B | |
| 38 | POTTSVILLESO | 265.5 | B | 269.6 | B | 535.1 | B | |
| 39 | JACKSONCOUNTY SD | 267.5 | B | 267.3 | B | 534.8 | B | |
| 40 | BALD KNOB SD | 265.0 | B | 269.4 | B | 534.4 | B | |
| 41 | GENOA CENTRAL SD | 263.5 | B | 270.9 | B | 534.4 | B | |
| 42 | WHITE CO CENTRAL SD | 267.1 | B | 266.9 | B | 534.0 | B | |
| 43 | HARMONY GROVEBenton SD | 263.6 | B | 270.3 | B | 533.9 | B | |
| 44 | HEBER SPRINGS SD | 264.7 | B | 269.2 | B | 533.9 | B | |
| 45 | POCAHONTAS SD | 263.6 | B | 270.2 | . B | 533.8 | B | |
| 46 | RUSSELLVILLE SD | 263.9 | B | 269.5 | B | 533.4 | B | |
| 47 | CALICO ROCK SD | 267.6 | B | 265.5 | B | 533.1 | B | |
| 48 | BEEBE SD | 263.7 | B | 268.2 | B | 531.9 | B | |
| 49 | DEER/MT. JUDEA | 263.6 | 8 | 268.2 | B | 531.8 | – B | |
| 50 | JESSIEVILLE SD | 264.1 | B | 267.7 | B | 531.8 | B | |
| 51 | SILOAM SPRINGS SD | 263.1 | B | 268.0 | B | 531.1 | B | |
| 52 | BOONEVILLE SD | 263.2 | B | 267.0 | B | 530.2 | B | |
| 53 | MCCRORY SD | 263.7 | B | 265.3 | B | 529.0 | B | |
| 54 | OZARK SD | 263.6 | 8 | 265.2 | B | 528.8 | B | |
| 55 | SHERIDAN SO | 261.7 | C | 272.5 | B | 534.2 | 8- | |
| 56 | MAMMOTH SPRING SD | 261.5 | C | 271.0 | B | 532.5 | 8- | |
| 57 | KIRBY SO | 260.0 | C | 271.8 | B | 531.8 | 8- | |
| 56 | ROGERS SO | 262.1 | C | 269.2 | B | ·531.3 | 8- | |
| 59 | HUNTSVILLE SD | 258.7 | C | 272.4 | B | 531.1 | 8- | |
| 60 | HILLCRESTSD . | 259.9 | C | 270.8 | B | 530.7 | B- | |
| 61 | VILONIA SD | 263.0 | C | 267.4 | B | 530.4 | 8- | |
| 62 | CLEVELAND COUNTYDIST. | 261.9 | C | 268.0 | B | 529.9 | 8- | |
| 63 | OUACHITA RIVER SD | 258.9 | C | 270.8 | B | 529.7 | B- | |
| 64 | JASPER SO | 259.3 | C | 270.0 | B | 529.3 | B- | |
| 65 | ELKINS SD | 257.5 | C | 271.6 | B | 529.1 | B- | |
| 66 | NEMO VISTA SD | 257.4 | C | 271.2 | B | 528.6 | B- | |
| 67 | MENA SD | 259.8 | C | 268.7 | B | 528.5 | 8- | |
| -68
69 |
GRAVETTE SD | 262.3 | C | 266.2 | B | 528.5 | B- | |
| RIVERVIEW SD | 262.4 | C | 265.9 | B | 528.3 | B- | ||
| 70 | BROOKLAND SD | 259.2 | C | 268.9 | B | 528.1 | B- | |
| .,.. 7-.1-.
72 |
ALPENA SD | 261.8. | C | 265.9 | B | 527.7 | 8- | |
| VALLEY SPRINGS SD | 259.4 | C | 268.0 | B | 527.4 | B- | ||
| 73 | PRAIRIE GROVESD .. | 260.3 | C | 266.8 | B | 527.1 | 8- | |
| 74 | RIVERSIDE SD SLOANHENDRIX SD | 259.2 | C | 267.7 | B | 526.9 | B- | |
| 75 | 262.8 | C | 264.1 | B | 526.9 | B- | ||
| -·76 | PARIS SD | 261.3 | C | 265.5 | B | 526.8 | B- | |
| 77 | BARTONLEXA SD | 262.8 | C | 263.9 | B | 526.7 | 8- | |
| 78 | COTTER SD | 258.1 | C | 268.6 | B | 526.7 | B- | |
| 79 | MOUNTAINBURG SD | 259.2 | C | 267.4 | B | 526.6 | B- | |
| – | Grade B+._E! and B-Averaaes | 264.6 | 270.8 | 535.3 | ||||
P_ line, Appendix One
| School District Names with | Dlstric:t
Language Standard Scores 260.7 261.6 258.4 258.4 254.7 258.7 261.3 258.6 259.8 258.9 260.1 260.3 258.3 256.4 260.0 259.9 256.7 263.1 255.9 255.4 258.3 257.7 255.3 255.5 257.8 257.3 257.9 257.8 256.3 256.8 254.1 256.2 253.0 253.5 255.2 250.1 – 252.5 251.3 261.4 |
District | DistrictMath | District | Combined | Combined
District Grade C+ C+ C+ C+ C+ C+ C+ C+ C+ C+ C+ —C·+ C+ C+ C+ – C+ C+ C+ C+ C+ C+ C+ C+ C+ C+ C+ C+ C+ C+ C+ C+ C+ C+ C+ C+ C+ C+ C+ C |
||
| Combined C+, C or C-Grades | Verbal | Standard | Math | District | ||||
| No.
1 |
N Academic Weak”
WYNNESD |
Grades
” C |
Scores
265.0 |
Grades
B |
Standard Scores
525.7 |
|||
| 2 | FARMINGTON SD | C | 263.9 | B | 525.5 | |||
| 3 | ATKINS SD | C | 266.8 | B | 525.2 | |||
| 4 | BLACK ROCK SD | C | 266.8 | B | 525.2 | |||
| 5
6 |
DOVER SD
MAGAZINE SD |
C
C |
270.4
266.2 |
B
B |
525.1
524.9 |
|||
| 7
8 9 |
DIERKSSD
GENTRY SD FORT SMITHSD |
C
C C |
263.5
266.1 264.7 |
B
B B |
524.8
524.7 524.5 |
|||
| 10 | GLEN ROSE SD | C | 265.6 | B | 524.5 | |||
| 11 | SPRINGDALE SD | C | 2.64.3 | 8 | 524.4 | |||
| 12 | BISMARCK SD | C | 264.0 | B | 524.3 | |||
| 13
14 |
RECTORSD CLINTONSD | C C | 265.7
267.2 |
B B | 524.0
523.6 . |
|||
| 15 | SOLITHSIDE SD | C | 263.5 | B | 523.5 | |||
| 16 | COUNTY LINE SD | C | 263.3 | B | 523.2 | |||
| 17 | VANBUREN SD | C | 266.5 | B | 523.2 | |||
| 18 | FOREMAN SD | B | 259.9 | C | 523.0 | |||
| 19 | HIGHLAND SD | C | 267.1 | B | 523.0 | |||
| 20 | PANGBURN SD | C | 267.6 | 8 | 523.0 | |||
| 21 | VIOLA SD | C | 264.5 | B | 522.8 | |||
| 22 | MAGNOLIA SD | C | 264.9 | B | 5.22.6 | |||
| 23 | OZARK MOUNTAIN | C | 266.9 | B | 522.2 | |||
| 24 | STAR CITYSD | C | 266.4 | B | 521.9 | |||
| 25 | ALMA SD | C | 264.0 | B | 521.8 | |||
| 26 | PIGGOTT SD | C | 264.4 | B | 521.7 | |||
| 27 | GUYPERKINS SD | C | 263.6 | B | 521.5 | |||
| 28 | FOUKE SD | C | 263.4 | B | 521.2 | |||
| 29 | PERRYVILLE SD | 521.1 | ||||||
| C | 264.8 | B | ||||||
| 30 | CAVE CITY SD | C | 264.2 | B | 521.0 | |||
| 31 | SEARCY COUNTYSDtMarshalll | C | 266.1 | 8 | 520.2 | |||
| 32 | DEQUEEN SD | C | 263.8 | B | 520.0 | |||
| 33
34 |
WESTSIDE CONS SD
BAY SD |
C C | 266.2
265.5 |
8
B |
519.2
519.0 |
|||
| 35 | YELLVILLESUMMIT SD | C | 263.6 | B | 518.8 | |||
| 36
37 |
DANVILLESD LEADHILL SD | 518.4
516.8 |
||||||
| C C | 268.3
264.3 |
B B | ||||||
| 38
39 |
GREEN FOREST SD CEDAR RIDGE | C
C |
263.8
262.8 |
B
C |
515.1
52-4.2 |
| 40 | OMAHA SD | 261.9 | C | 261.1 | C | 523.0 | C | |
| 41 | MAGNET COVE SD | 259.0 | C | 263.0 | C | 522.0 | C | |
| -42
43 |
SOUTH COmYAY CO SD | 261.0 | C | 260.1 | C | 521.1 | C | |
| SPRING HILL SO | 261.7 | C | 258.3 | C | 520.0 | C | ||
| 44 | MOUNTIDASD | 256.6 . | C | 263.1 | C | 519.7 | C | |
| 45 | TWIN RIVERS | 256.7 | C | 261.4 | C | 518.1 | C | |
| 46 | MAYFLOWER SD | 257.9 | C | 260.1 | C | 518.0 | C | |
| 47 | CARLISLE SD | 2549 | C | 262.8 | C | 517.7 | C | |
| 48 | PARAGOULD SD | 256.1 | C | 261.0 | C | 517.1 | C | |
| 49 | MOUNTAIN PINE SD | 256.2 | C | 260.5 | C | 516.7 | C | |
| 5(} | CROSSETT SD | 256.3 | C | 260.1 | C | 516.4 | C | |
| ·51 | HOXIE SD | 255.7 | C | 260.6 | C | 516.3 | C | |
| 52 | MULBERRY SD | 257.7 | C | 256.3 | C | 516.0 | C | |
| 53 | WESTSIDE SD | 255.5 | C | 2604 | C | 515.9 | C | |
| 54 | LOCKESBURG SD | 255.1. | C | 260.1 | C | 515.2 | C | |
| 55 | BRINKLEY SD | – 259.2 | C | 255.9 | C | 515.1 | C | |
| 56 | BRADFORD SD | 255.2 | C | 259.6 | C | 514.8 | C | |
| 57 | LAVACA SD | 252.6 | C | 262.1 | C | 514.7 | C | |
| 58 | LONOKE SD | 256.5 | C | 258.2 | C | 514.7 | C | |
| 59 | IZARD COUNTY CONSSO | 253.2 | C | 261.4 | C | 514.6 | C | |
| 60 | BEARDEN SD | 258.7 | C | 255.7 | C | 514.4 | C | |
| 61 | MARKED TREE SO | 255.0 | C | 259.0 | C | 514.0 | C | |
| 62 | QUITMAN SO | 256.1 | C | 257.9 | C | 514.0 | C | |
| 63 | HARMONY GROVECamden SO | 254.3 | C | 259.6 | C | 513.9 | C | |
| 64 | WATSON CHAPEL SD | 260.7 | C | 253.2 | C | 513.9 | C | |
| 65 | BUFFALO ISCENTRALSD | 253.8 | C | 260.0 | C | 513.8 | C | |
| 66 | WESTFORKSO | 257.2 | C | 256.6 | C | 513.8 | C | |
| 67 | HECTOR SD | 252.1 | C | 281.3 | C | 513.4 | C | |
| 68 | WOODLAWNSD – | 256.5 | C | 256.7 | C | 513.2 | C | |
| 69 | HOT SPRINGS SD | 253.3 | C | 259.4 | C | 512.7 | C | |
| 70 | MIDLAND SD | 256.9 | C | 255.8 | C | 512.7 | C | |
| 71 | SO MISSISSIPPI CO SD | 253.1 | C | 258.9 | C | 512.0 | C | |
| 72 | EAST END SD | 253.2 | C | 257.8 | C | 511.0 | C | |
| 73 | GREENLAND SD | 251.1 | C | 259.9 | C | 511.0 | C | |
| 74 | MARION SD | 250.6 | C | 259.8 | C | 510.4 | C | |
| 75 | JUNCTION CITY SD | 251.5 | C | 2588 | C | 510.3 | C | |
| 76 | EAST POINSETT SD | – | 250.3 | C | 259.6 | C | 509.9 | C |
| n | MONTICELLO SD | 254.0 | C | 255.5 | C | 509.5 | C | |
| 78 | ELDORADO SO | 252.2 | ··-C-
C |
256.7 | C | 508.9 | C | |
| 79 | PULASKI COUNTY SD | 255.9 | 252.9 | C | 508.8 | C | ||
| 80 | WEINER SD | 253.6 | C | 255.2 | C | 508.8 | C | |
| 81 | CENTERPOINT SD | 253.6 | C | 255.1 | C | 508.7 | C | |
|
|||||||||||||||||||||||||||||||||||||||||||||||||||||||||||||||||||||||||||||||||||||||||||||||||||||||||||||||||||||||||||||||||||||||||||||||||||||||||||||||||||||||||||||||||||||||||||||||||||||||||||||||||||||||||||||||||||||||||||||||
1
Page Six, Appe- OM
|
No. |
School DistrictNameswith Combined D+ Grade
“AcademicAlert” |
District Language Standard Scores | DistrictVerbal Grades | DistrictMath Standard Scores | District Math Grades | Combined
•· District StandardScorea |
Combined
District Grade |
| 1 | WONDERVIEWSD | 249.1 | D | 250.3 | C | 499.4 | D+ |
| 2 | NASHVILLESD | 246.5 | — D | 252.7 | C | 499.2 | D+ |
| 3 | NEVADA SD | 245.0 | D | 253.9 | C | 498.9 | D+ |
| 4 | PINE BLUFF SD | 250.5 | C | 248.2 | D | 498.7 | D+ |
| 5 | HORATIO SD | 243.9 | D | 254.7 | C | 498.6 | D+ |
| 6 | DECATUR SD | ·-243.2 | D | 255.1 | C | 498.3 | D+ |
| 7 | DES ARC SD | 246.0 | D | 252.1 | C- | 498.1 | D+ |
| 8 | WESTERNYELL CO SD | 245.4 | D | 251.8 | C | 497.2 | D+ |
| 9 | BAUXITE SD | 245.6 | D | 251.4 | C | 497.0 | D+ |
| 10 | DUMAS SD | 244.7 | D | 250.3 | C | 495.0 | D+ |
| 11 | DELIGHT SD | 242.6 | D | 251.8 | C | 494.4 | D+ |
| Grade D+Averanes | 245.7 | 252.0 | _,.T |
Page Se-ttn, Appendb<One
|
No. |
School District Hamnwith Combined D andD- Grades
# Academic Distress” |
District Language Standard Scores | District Verbal Grades | DistrictMath Standard Scores | District MathGrades | CombinedDistrictStandard Scorea | Combined District Grade |
| 1 | MANILA SD | 249.3 | D | 247.3 | D | 496.6 | D |
| – | WARREN SD | 248.1 | D | 246.6 | D | 494-.9 | D |
| MCGEHEE SD | 246.1 | D | 247.9 | D | 494.0 | D | |
| 4 | DREW CENTRAL SD | 244.2 | D | 249.5 | D | 493.7 | D |
| 5 | STRONG SD | 244.9 | D | 248.5 | D | 493.4 | D |
| 6 | FORDYCE SD | 248.5 | D | 244.8 | D | 493.3 | D |
| 7 | LAFAYETTESD .. | 240.2 | F | 253.1 | C | 493.3 | D |
| 8 | TEXARKANA SD | 243.0 | D | 248.2 | D | 491.2 | D |
| 9 | CROSS COUNTY SD | 234.6 | F | 255.8 | C | 490.4 | D |
| 10 | NORTH LITTLE ROCK SD | 243.8 | D | 248.5 | D | 490.3 | D |
| 11 | WEST MEMPHIS SD | 242.4 | D | 246.7 | D | 489.1 | D |
| 12 | HERMITAGE SD | 243.5 | D | 245.5 | D | 489.0 | D |
| 13 | CLARENDON SO | 242.4 | D | 246.0 | D | 488.4 | D |
| 14 | ENGLAND SD | 241.7 | D | 246.2 | D . | 487.9 | D |
| 15 | SMACKOVER SD | 241.2 | F | 248.9 | . D | 488.1 | D- |
| 16 | ALTHEIMER UNIFIED SD | -239.8 | . F | 246.6 | D | 486.4 | D- |
| 17 | AUGUSTA SD | 239.5 | F | 245.9 | D | 485.4 | D- |
| 18 | BLEVINS SD | 239.2 | F | 248.1 | D | 485.3 | D- |
| 19 | MARVELL SD | 244.5 | D | 239.7. | F | 484.2 | D- |
| 20 | PALESTINEWHEATLEYSD | 235.7 | F | 248.1 | D | 483.8 | D- |
| 21 | OSCEOLA SD | 239.5 | F | 241.9 | D | 481.4 | D- |
| 22 | STEPHENS SD | 237.1 | F | 244.3 | D | 481.4 | D- |
| 23 | LAKESIDE SD – LakeVlllaae | 242.2 | D | 237.9 | F | 480.1 | D- |
| 24 | HUGHES SD | 238.1 | F | 240.6 | D | 478.7 | D- |
| Grade D+ Averaaea | 242.1 | 246.3 | 488.3 |
Page Elg!, Appendix One
|
No. |
School DistrictNames with Combined F Grade
“Academic Distress” |
,
District Language StandardScores |
District Verbal Grades | DistrictMath Standard Scorea | District Math Grades | Combined DistrictStandardScores | Combined District Grade |
| 1 | HOPE SD | 238.8 | F | 240.3 | F | -4-7·9-.1
477.3 |
. F |
| 2 | LEE COUNTY SD | 240.2 | F | 237.1 | F | F | |
| 3 | FORREST CITY SD | 237.0 | F | 240.2 | F | 477.2 | F |
| 4 | BLYTHEVILLE SD | 241.2 | F | 235.1 | F | -4-76-.3
471.4 |
F |
| 5 | HELENA/WHELENASD | 238.5 | F | 232.9 | F | F | |
| 6 | DERMOTT SD | 233.5 | F | 235.1 | F | 468.6 | F |
| 7 | DOUARWAYSD | 232.8 | F | 235.4 | F | 468.2 | F |
| B | TURRELL SD | 232.9 | F | 235.0 | F | 467.9 | F |
| 9 | MINERAL SPRINGSSO | 229.9 | F | 236.7 | F | 466.6 | F |
| 10 | EARLE SD | 232.6 | F | 227.3 | F | 459.9 | F |
| 11 | EUDORA SD | 229.9 | F | 227.2 | F | 457.1 | F |
| 12 | ELAINE SD | 222.5 | F | 230.0 | F | 452.5 | F |
| 13 | WALDO SD
Grade FAve. s |
210.9
232.4 |
F | 226.9
233.8 |
F | 437.8
466.1 |
F |
| District Language StandardScores | DistrictMathStandard Score | DistrictCombined.
Score |
|
| StateAvera.es | 256.1 | 281.S | 517.7 |
Appendix One: Modified
Analyals of 2008 lo- Test of Basic lkUI Standard lconts
for Grading Arkansas’ 251 Public SchCN>I Districts
Bued onNinth Grades ITBS Standard ac-
And • Modified Standard N.onnal Bell Carve Shape Dlatrlbutlon
Modified Grade Proportion ProbablUtles Relying on Nonnal DistributionPropertl” and their Associated z Values
90 to 100= A
Greater than +1.282
85 to 89.9 =B
Greater than +.385
20to64.9 • C
Greater than-0.841
5 to 19.9″‘ D
Greater than-1.645
Oto4.9• F
l.ess than-1.646
| National Lan uaae and Math Standard ScoreMeans | 259.0 |
| Lanauaae Standard Score StandardDeviation | 10.735 |
| Math Standard Score Standard Deviation | 11.207 |
Lan Break “SS” Values Math Break “SS” Values
| Greater thanor Mual to”A” | 272.8 | Greater thanor aaual to”A” | 273.4 | |
| Greater than or eaual to”B” • 283.1 to 272.7 | Greater thanor eaual to”B” | 283.3 to273.3 . | ||
| Greater thanor eaual to”C” | 250.0 to263.0 | Greater thanor aaual to”C” | 249.6 to 283.2 | |
| Greater thanor eaual to”D” | 241.3 to249.9 | Greater thanor eaual to”D” | 240.6 to 249.5 | |
| Less thaneaualto “F” | 241.3 | Len thaneaual to “f” | 240.6 | |
|
|||||||
Combined SS Lan ua e and Math Score Breaks for+ or- Grade Determinations
- /TBS Scores were available at theWeb Site for the Arl<ansasDeparlment of 8:/ucation.
PageTan,Appendix One
Appendix Two: NotModified
Analysis of 2006 IowaTest of Basic SkillStandard Scores forGrading Arkansas’251 Public SchoolDistricts
Based on NinthGrades ITBS StandardScores
And a Standard (not moclffled) Normal Bell Curve ShapeDistribution
|
No. |
SchoolDistrictNameswith
Combined A orA- Grades “AcademicSuccess” |
District language StandardScores | District LanguageGrades | DlatrtctMath
Standard Scores |
District Math Grades | CombinedDistrict StandardScores | Combined
Dlstrtct Grade |
| 1 | HAZEN SD | 280.0 | A | 284,8 | A | 564.8 | A |
| 2 | VALLEY VIEWSD | 276.9 | A | 284.9 | A | 561.8 | A |
| 3 | BENTONVILLESD | 279.1 | A | 282.1 | A | 561.2 | A |
| 4 | DEVALLSBLUFF SD | 283.4 | A | 274.4 | A | 557.8 | A |
| 5 | OUACHITA SD | 273.4 | A | 283.2 | A | 556.6 | A |
| 6 | ARMORELSD | 2TT.3 | A | 279.0 | A | ,556.3 | A |
| 7 | LAKESIDE SO- Hot nos | 277.1 | A | 276.8 | A | 553.9 | A |
| 8 | CONWAY SD | 273.2 | A | 280.6 | A | 553.8 | A |
| 9 | MAYNARD SD | 273.1 | A | 276.4 | A | 549.5 | A |
| 10 | FAYETTEVILLESD | 274.6 | A | 274.4 | A | 549.0 | A |
| 11 | GREENWOODSD | 273.1 | A | 274.8 | A | 547.9 | A |
| 12 | EUREKASPRINGS SD | 275.5 | A | 272.9 | B | 548.4 | A- |
| 13 | FLIPPIN SD | 271.9 | B | 276.1 | A | 548.0 | A- |
| 14 | NETTLETONSD | 269.9 | B | 276.6 | A | 546.5 | A- |
| Grade A and A•Averages | 275.6 | 278.4 | 55′.0 |
PageOne, Appendix T-
|
|||||||||||||||||||||||||||||||||||||||||||||||||||||||||||||||||||||||||||||||||||||||||||||||||||||||||||||||||||||||||||||||||||||||||||||||||||||||||||||||||||||||||||||||||||||||||||||||||||||||||||||||||||||||||||||||||||||||||||||||||||||||||||||||||||||||||||||||||||||||||||||||||||||||||||||||||||||||||||||||||||||||||||||||||||||||||||||||||||||
| 40 | WHITE CO CENTRAL SD | 267.1 | B | 266.9 | B | 534.0 | B’ | |
| 41 | HEBER SPRINGS SD | 264.7 | B | 269.2 | B | 533.9 | B. | |
| 42 | CALICO ROCK SD | 267.6 | B | 265.5 | B | 533.1 | B- | |
| 43 | POYEN SD | 263.2 | C | 272.0 | B | 535.2 | B- | |
| 44 | GENOA CENTRAL SD | 263.5 | C | 270.9 | B | 534.4 | B- | |
| 45 | SHERIDAN SD | 261.7 | C | 272.5 | B | 534.2 | B– | |
| 48 | HARMONY GROVE Benton SD | 263.6 | C | 270.3 | B | 533.9 | B- | |
| 47 | POCAHONTAS SD | 263.6 | C | 270.2 | B | 533.8 | B- | |
| 48 | RUSSELLVILLE SD | 263.9 | C | 269.5 | B | 533.4 | B· | |
| 49 | MAMMOTH SPRINGSD . | 261.5 | C | 271.0 | 8 | 532.5 | B- | |
| 50 | BEEBE SD . | 263.7 | C | 268.2 | B | 531.9 | 8- | |
| 51 | DEER/MT. JUDEA | 263.6 | C | 268.2 | B | 531.8 | B- — | |
| 52 | JESSIEVILLE SD | 264.1 | C | 267.7 | B | 531.8 | B- | |
| 53 | KIRBY SD | 260.0 | C | 271.8 | B | 531.8 | B- | |
| 54 | ROGERS SD | 262.1 | C | 269.2 | B | 531.3 | 8- | |
| 55 | SILOAM SPR-IN-GS SD
61-iUNTSVILLE SD |
263.1 | C | 268.0 | B | 531.1 | B– | |
| 5 | 258.7 | C | 272.4 | B | 531.1 | B- | ||
| 57 | HILLCREST SD | 259.9 | C | 270.8 | B | 530.7 | B– | |
| 58 | VILONIA SD | 263.0 | C | 267.4 | B | 530.4 | B. –
B– |
|
| 59 | BOONEVILLE SD | 263.2 | C | . 267.0 | 8 | 530.2 | ||
| 60 | CLEVELAND COUNTY DIST. | 261.9 | C | 268.0 | B | 529.9 | 8- | |
| 61 | OUACHITA RIVER SD | 258.9 | C | 270.8 | B | 529.7 | B- | |
| Grade B+, B & B-Averaaes | 265.7 | ‘271.8 | 537.5 | |||||
Pagellvw, Appendix Two
|
|||||||||||||||||||||||||||||||||||||||||||||||||||||||||||||||||||||||||||||||||||||||||||||||||||||||||||||||||||||||||||||||||||||||||||||||||||||||||||||||||||||||||||||||||||||||||||||||||||||||||||||||||||||||||||||||||||||||||||||||||||||||||||||||||||||||||||||||||||||||||||||||||||||||||||||||||||||||||||||||||||||||||||||||||||||||||||||||||
|
| 82 | MIDLAND SD | 256.9 | C | 255.8 | C | 512.7 | C | |
| 83 | MONTICELLOSD | 254.0 | C | 255.5 | C | 509.5 | C | |
| 84 | WEINER SD | 253.6 | C | 255.2 | C | 508.8 | C | |
| 85 | CENTERPOINTSD | 253.6 | C | 255.1 | C | 508.7 | C | |
| 86 | WICKES SD | 253.8 | C | 254.4 | C | 508.2 | C | |
| -87 | LEADHILL SD | 252.5 | D | 264.3 | C | 516.8 | C- | |
| 88 | GREENFOREST SD | 251.3 | D | 263.8 | C | 515.1 | C- | |
| 89 | LAVACA SD | 252.6 | D | 262.1 | C | 514.7 | C- | |
| 90 | IZARDCOUNTYCONS SD | 253.2 | D | 261.4 | C | 514.6 | C- | |
| 91 | HECTORSD . | 252.1 • | D | 261.3 | C | 513.4
512.7 |
C- | |
| 92 | HOT SPRINGSSD | 253.3 | D | 259.4 | C | C- | ||
| 93 | SOMISSISSIPPICO SD | 253.1 | D | 258.9 | C | 512.0 | C- | |
| 94 | EAST END SD | 253.2 | D | 257.8 | C | 511.0 | C- | |
| 95 | GREENLANDSO | 251.1 | D | 259,9 | C | 511.0 | C- | |
| 96 | ROSE BUD SO | 248.4 | 0 | 262.2 | C | 510.6 | C- | |
| 97 | MARION SD | 250.6 | 0 | 259.8 | C | 510.4 | C· | |
| 98 | CONCORD SD | 249.8 | D | 260.5 | C | 510.3 | C- | |
| 99 | JUNCTIONCITY SD | 251.5 | . 0 | 258.8 | C | 510,3 | C· | |
| 100 | EASTPOINSETT SD | 250.3 | D | 259,6 | C | 509,9 | C- | |
| 101 | ELDORADOSD | 252.2 | D | 256.7 | C | 508.9 | C- | |
| 102 | PULASKICOUNTY SD. | 255.9 | C | 252.9 | D | 508,8 | C- | |
| 103 | TWORIVERS | 250.8 | D | 257.7 | C | 508.5 | C- | |
| 104 | TRUMANN SD | 253.1 | D | 255.1 | C | 508.2 | C- | |
| 105 | CUTTER MRNGSTAR SD | 252.3 | D | 255.8 | C | 508.1 | C- | |
| 106 | HACKETT SD | 247.2 | D | 260.9 | C | 508.1 | C- | |
| 107 | HAMPTON SD | 249.9 | D | 257.7 | C | 507.6 | C- | |
| 108 | LINCOLN SD | 247.8 | D | 259.7 | C | 507.5 . | C- | |
| 109 | STUTTGARTSD | 250.6 | D | 256.6 | C | 507.4 | –C- | |
| 110 | PRESCOTT SD | 251.4 | D | 254.0 | C | 505,4 | C- | |
| 111 | CORNING SD | 245.7 | D | 259.2 | C | 504.9 | C- | |
| Grade C+, CandC-Avl!_raaes | 266.4 | 262.3 | 518.7 | |||||
PageSb(. Appendix Two
|
No. |
School DistrictNames with Combined D+Grade
“AcademicAlert” |
DistrictLanguageStandard Scores | District
• V11rbal Grades |
DistrictMath Standard Scores | District. Math Grades | Combined DistrictStandard Scores | Combined District Grade | ||
| 1 | HAMBURG SD | 250.6 | D | 255.7 | C | 506.3 | D+ | ||
| 2 | MURFREESBOROSD | 256.4 | C | 250.0 | D | 506.4 | -D+
D+ |
||
| 3 | NORPHLET SO | 249.5 | D | 255.8 | C | 505.3 | |||
| 4 | NEWPORT SD | 249.6 | D | 255.5 | C | 505.1 | D+ | ||
| 5 | WESTSIDE SD | 246.0 | D | 259.1 | C | 505.1 | D+ | ||
| 6 | WALDRON SD | 248.9 | D | 256.0 | _C.,,. | 504.9 | O+ | ||
| 7 | 246.6 | ·D | 504.7 | D+ | |||||
| GURDONSD_ | 258.1 | C | |||||||
| B | ·- | 247.9 | D | 256.7 | C | 504.6 | D+ | ||
| GOSNELLSD | |||||||||
| 9 | DEWITTSD | 249.7 | D | 254.5 | C | 504.2 | D+ | ||
| 10 | BRADLEY SO | 248.1 | D | 256.0 | C | 504.1 | D+ | ||
| 11 | ASHDOWN SD | 245.5 | D | 255.8 | C | 501.3 | D+ | ||
| 12 | MALVERN SO | 246.0 | D | 254.4 | C | 500.4 | D+ | ||
| Grade D+ Averaaes | 248.7 | 25 .6 | 504.4 | ||||||
- Pave Seven, Appe,,db< Two
|
|
No. |
SchoolDistrictName• with
Combined FGrade “AcademicDistress” |
District
Language StandardScore• |
District
Verbal Grades |
DistrictMath
Standard Scorea |
District
Math Gtades |
Combined
District StalldlitdScore• |
Combined
District Grade |
| 1 | MARVELLSD | 244.5 | F | 239.7 | F | 484.2 | F |
| 2
3 |
OSCEOLASD
STEPHENSSD |
239.5
237.1 |
F F | 241.9
244.3 |
F F | 481.4
481.4 |
F F |
|
| 11 | DERMOTT SD | 233.5 | F | 235.1 | F | 468.6 | |
| 12 | DOLLARWAY SD | 232.8 | F | 235.4 | F | 468.2 | |
| ,J.L | TURRELL SO | 232.9 | F | 235.0 | F | 467.9 | F |
| 14 | MINERALSPRINGS SO | 229.9 | F | 236.7 | F | 466.6 | F |
| DistrictLanguage Startdard Scores | 0-istrictMathStandard Score | DistrictCombined Score | |
| StateAveraaes | 256.1 | 261.5 | 517.7 |
P-seNI…,Y,-:,
Appendix Two: Not Mod!fied
|
Analysls of 2006 Iowa Test of Buie Sklll 5’aftdanl Scores
for Oracll1.t9 Adcanaas• 251 Publlo Sehool Dletrlcts
BMed on Ninth Grades ITBS StandudSc-
And a Modified Standard Normal Bell Curve Shape Distribution
Modified Grade Proportion Probabllltles Relying onNonna! Dlltr1butionProperties and their Associated z Values
90to100 • A
Greater than +1.282
70 to 89.9,. B
Greeter than+.524
30 to 89.11• C
Greater than-0.524
10to 29.9 =D
Greater than-1.282
0 to 9.9 • F
Leu than -1.282
| National Langua e and Math Standard ScoreMeans | 259.0 |
| Lanauaae Standard Score StandardDeviation | 10.735 |
| Math Standard Score Standard Deviation | 11.207 |
|
||||||||||||||||||||||||||
Language BN “SS” Values
Math Break “SS” Values
|
Combined SS Language anc!Jlatl’l Sc<>t’e Breaks for + or – Grade Determlnatlon1
- /TBS Scores were available at the Web Site for the ArkansasDepartment of Education.
P-Ton,Appendix Two